
Free Forms, Observer Guide
& Station Model Plot Tutorial
Download Charts and Forms Free
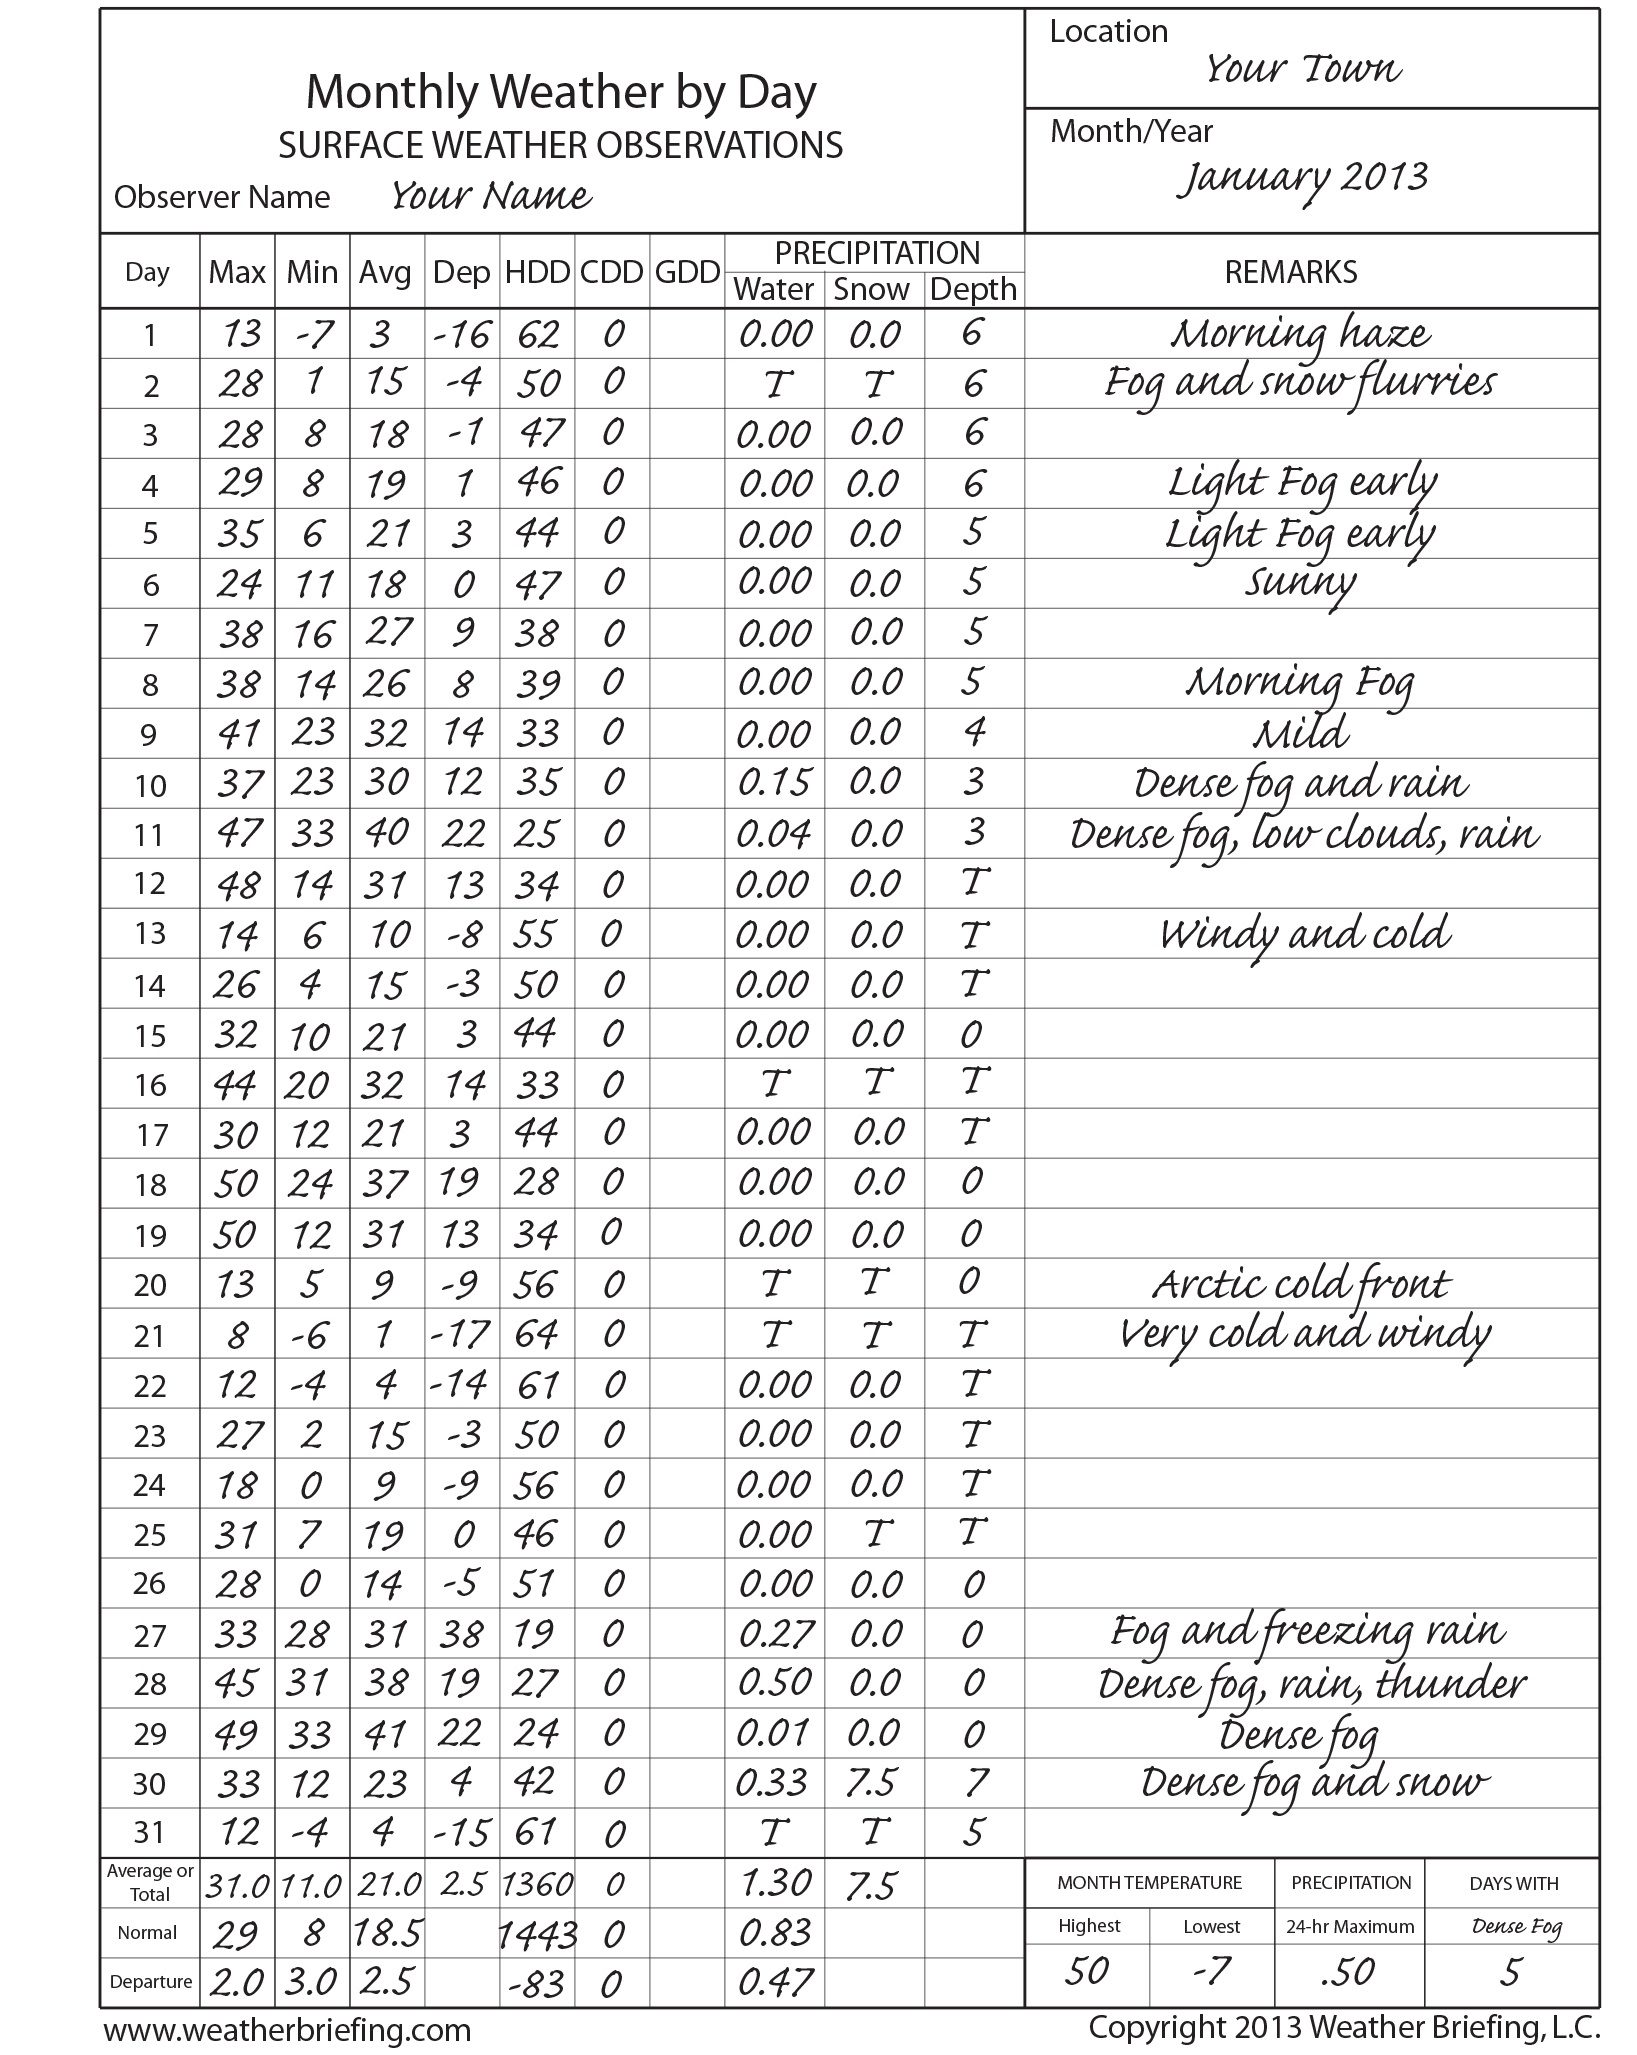
Month by Day Climate Form

Month by day climate form
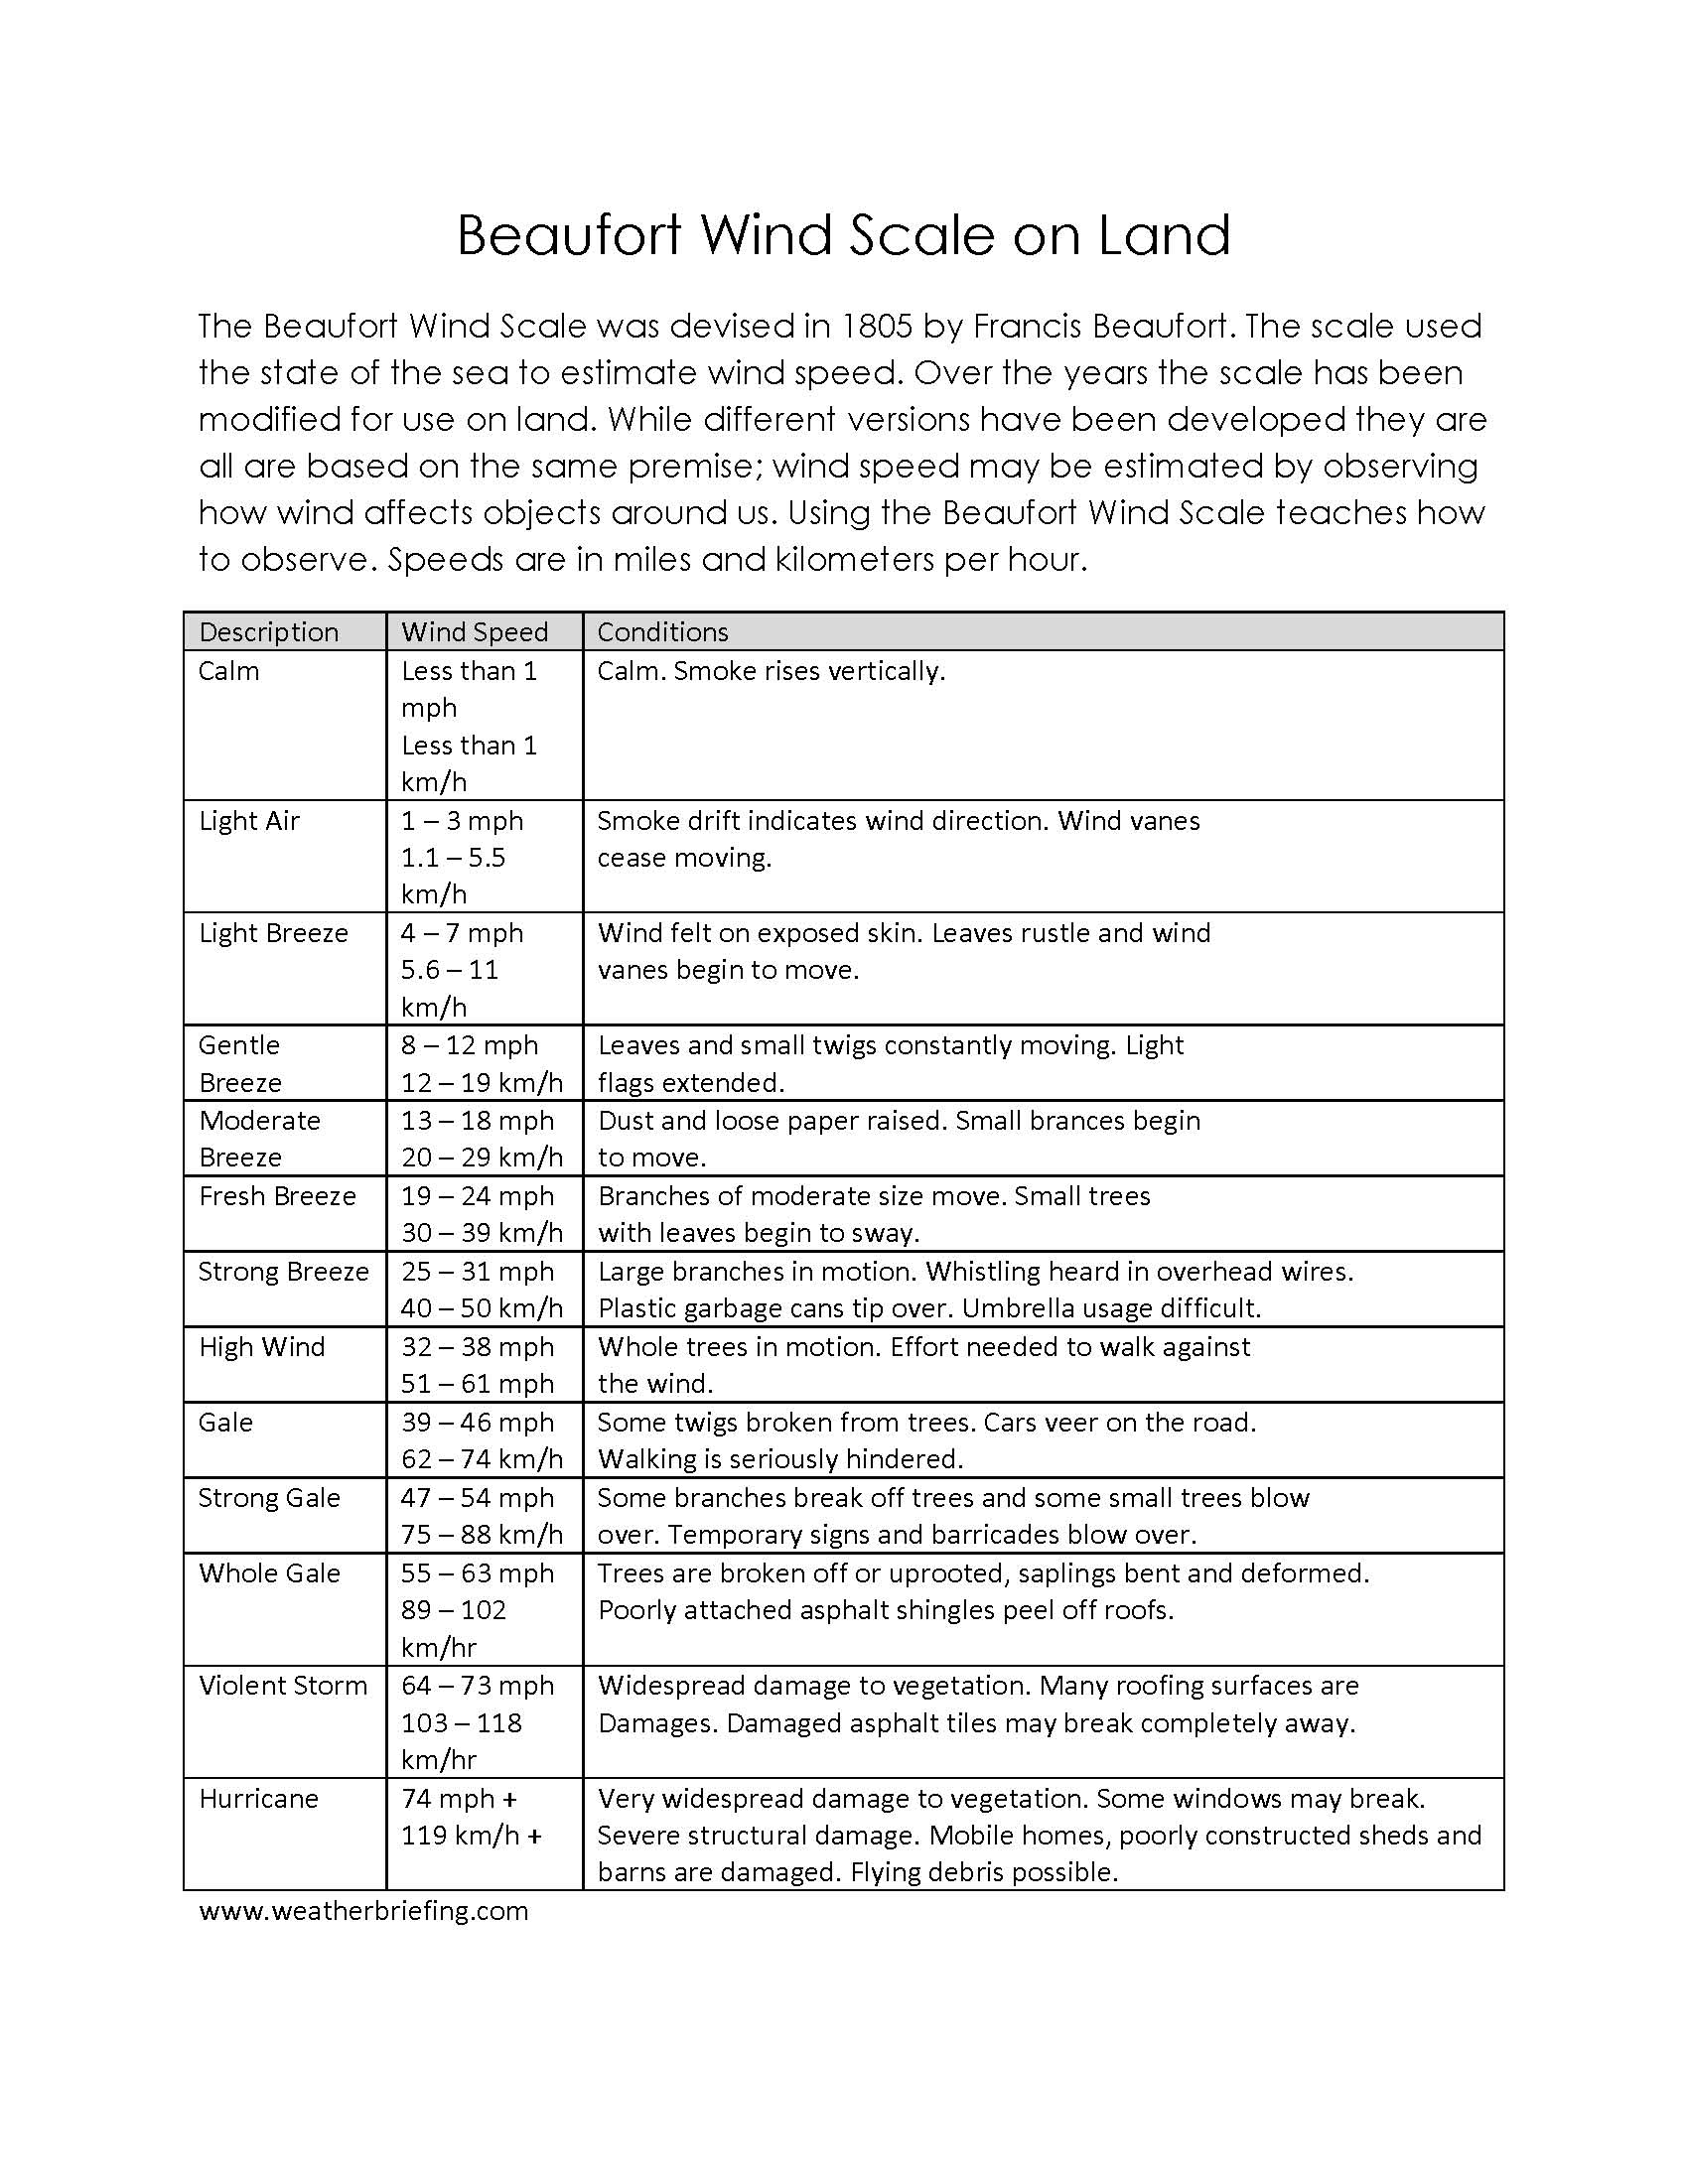
Beaufort Wind Scale
USA Plotting Map

Daily Weather by Hour

daily weather by hour form
Weather Log

USA Daily Weather Map

Station Model Plot Form
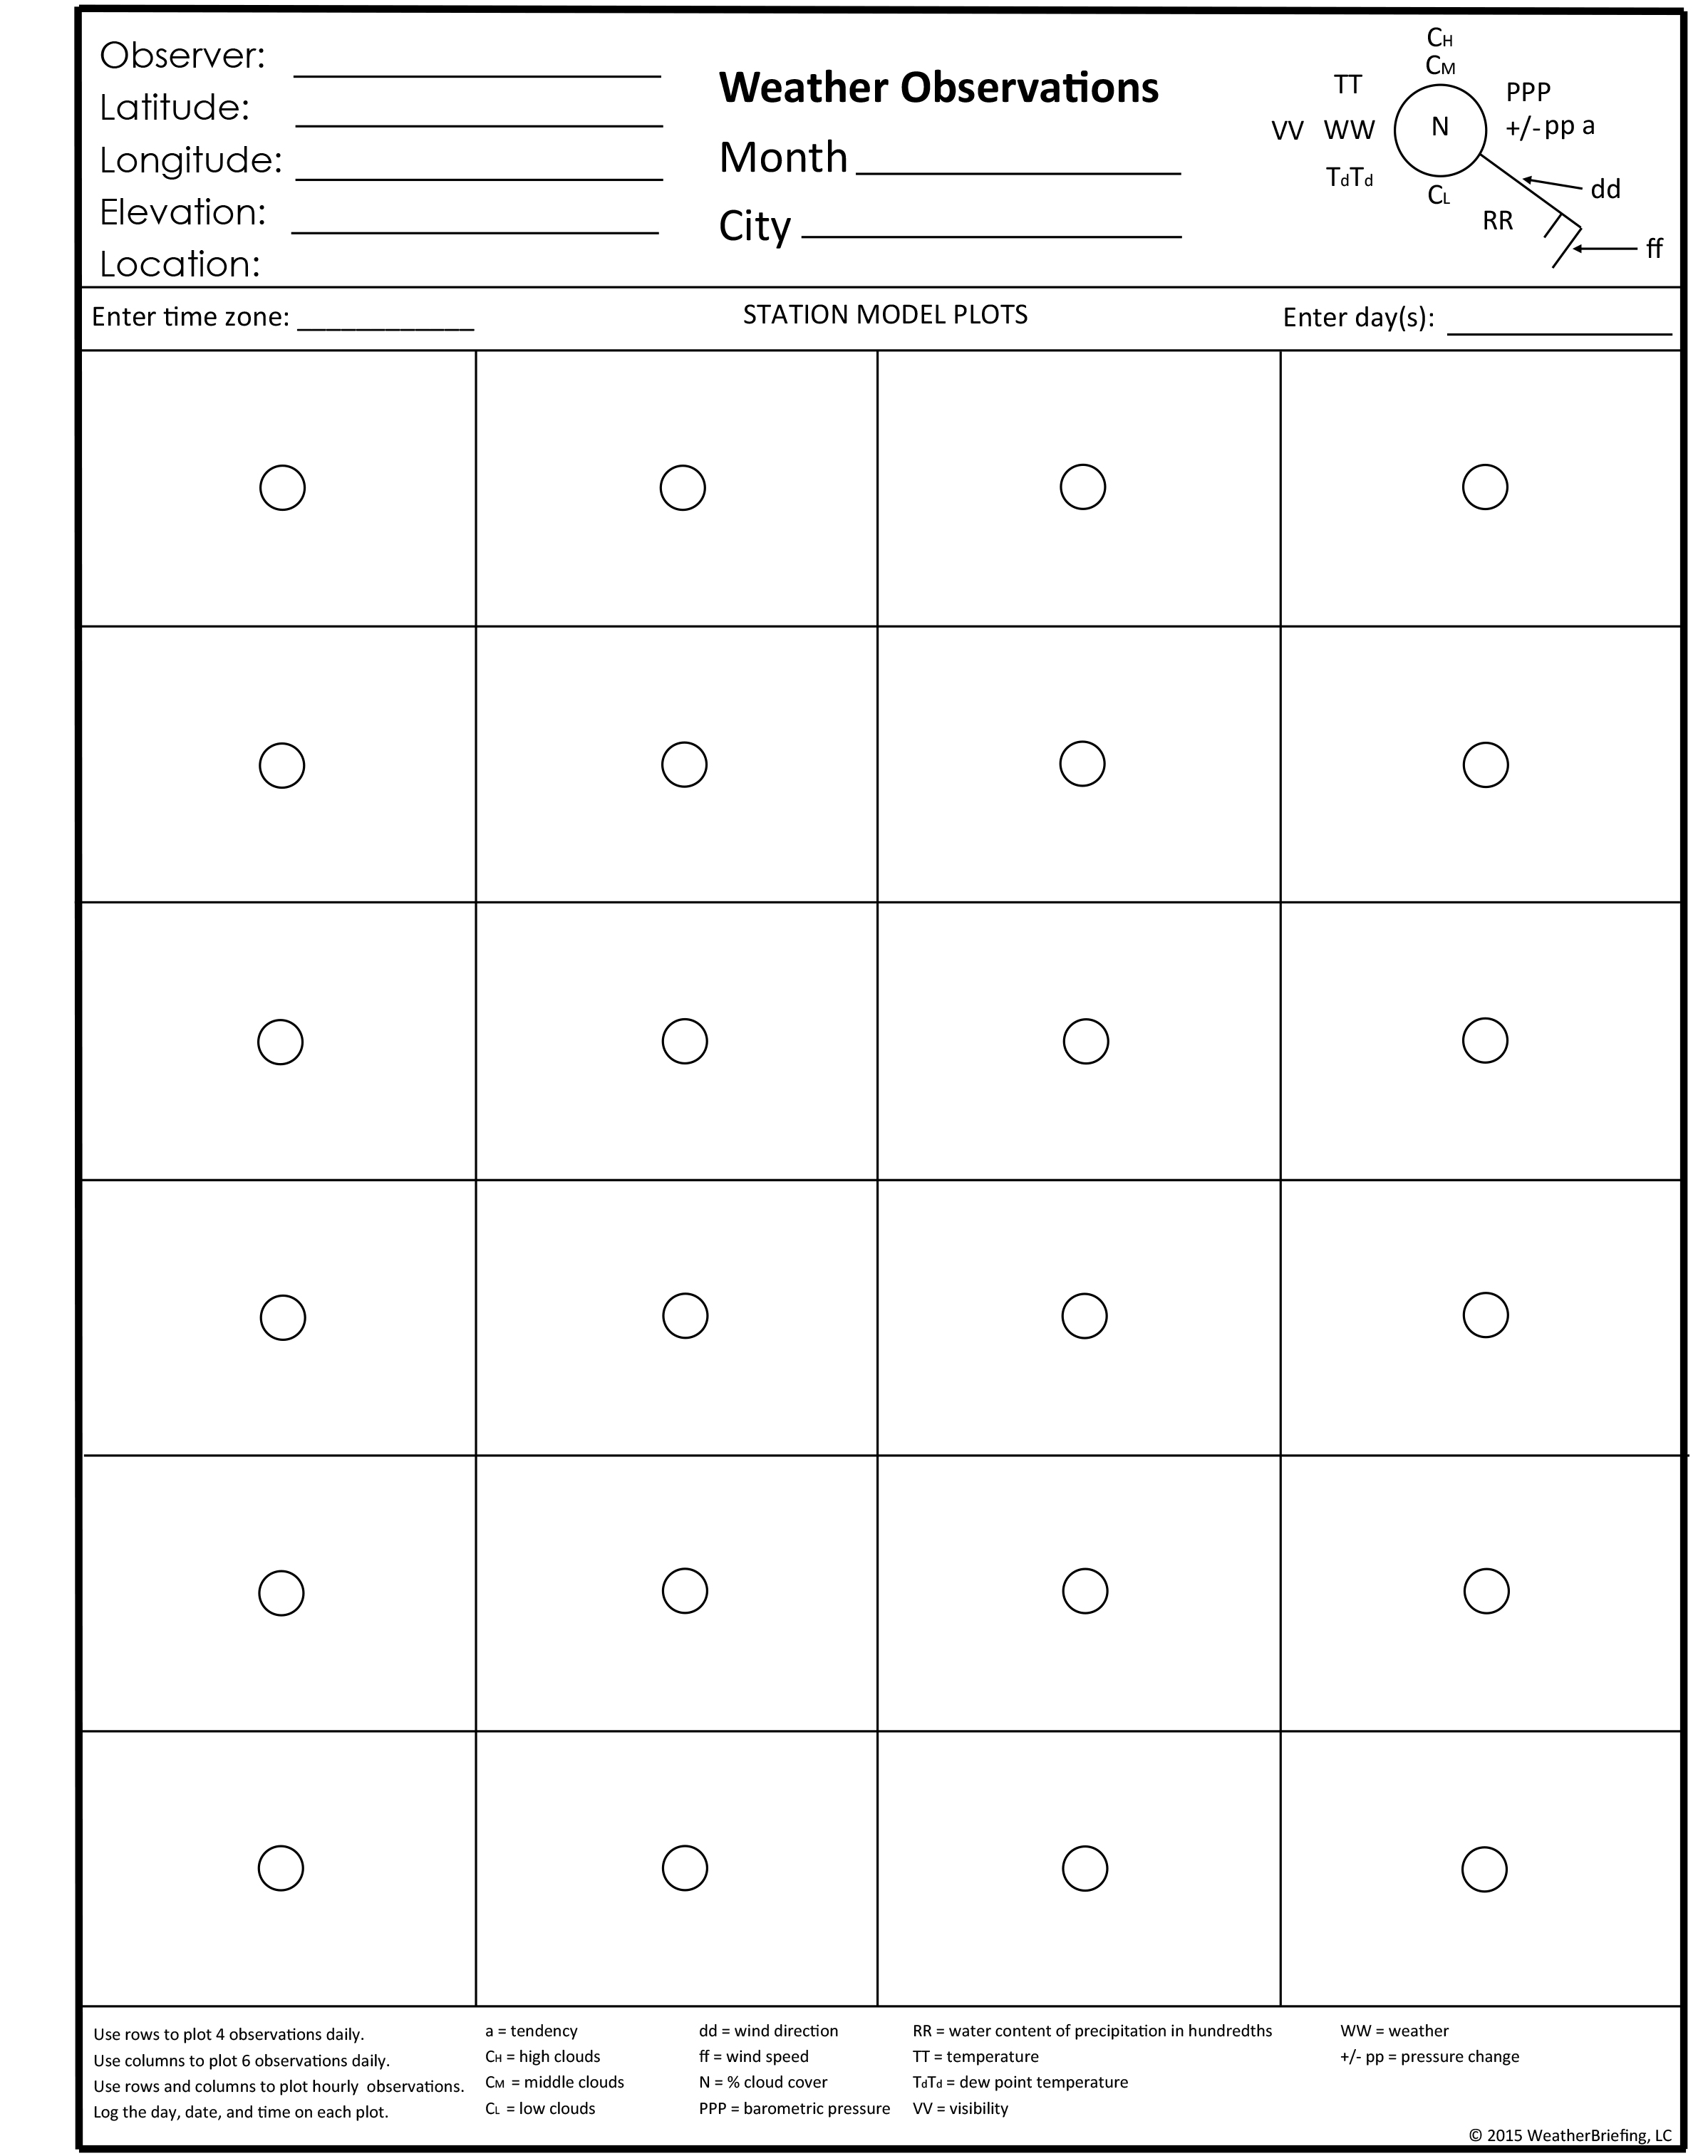
Station Model plot form
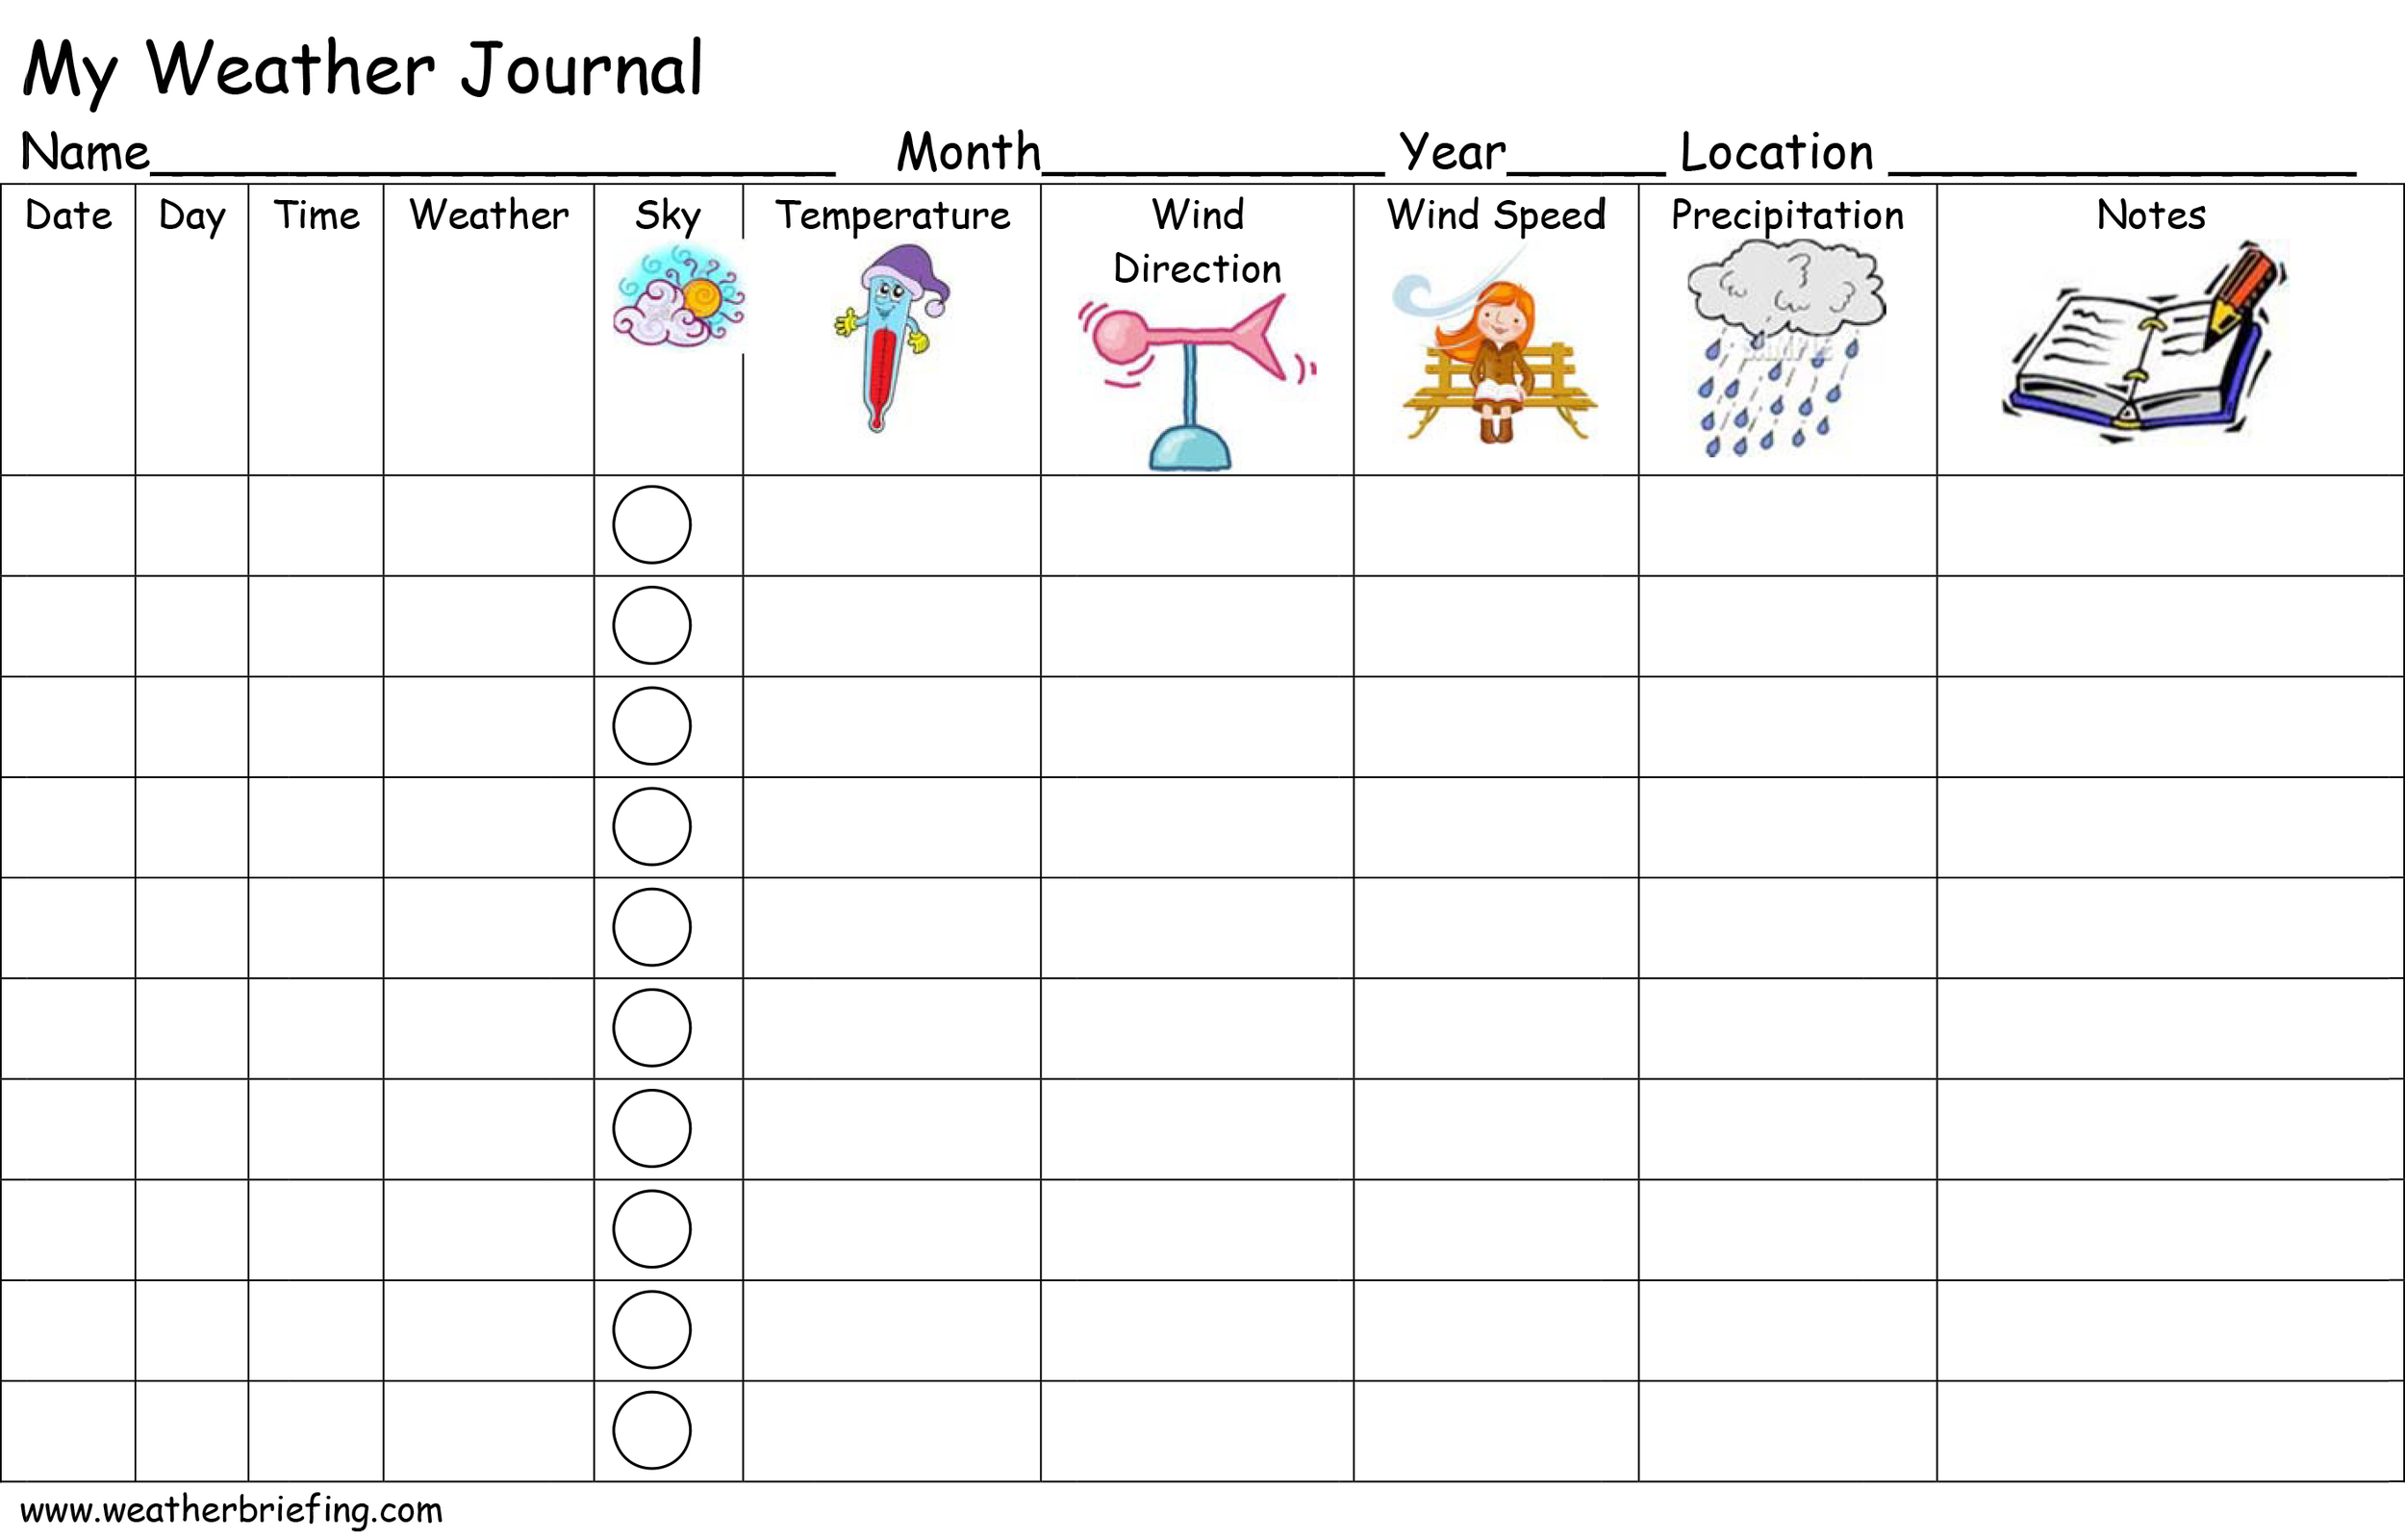
My Weather Journal for Children

The background map was plotted using Digital Atmosphere, which may be downloaded at www.weathergraphics.com.
Online Weather Observer Guide
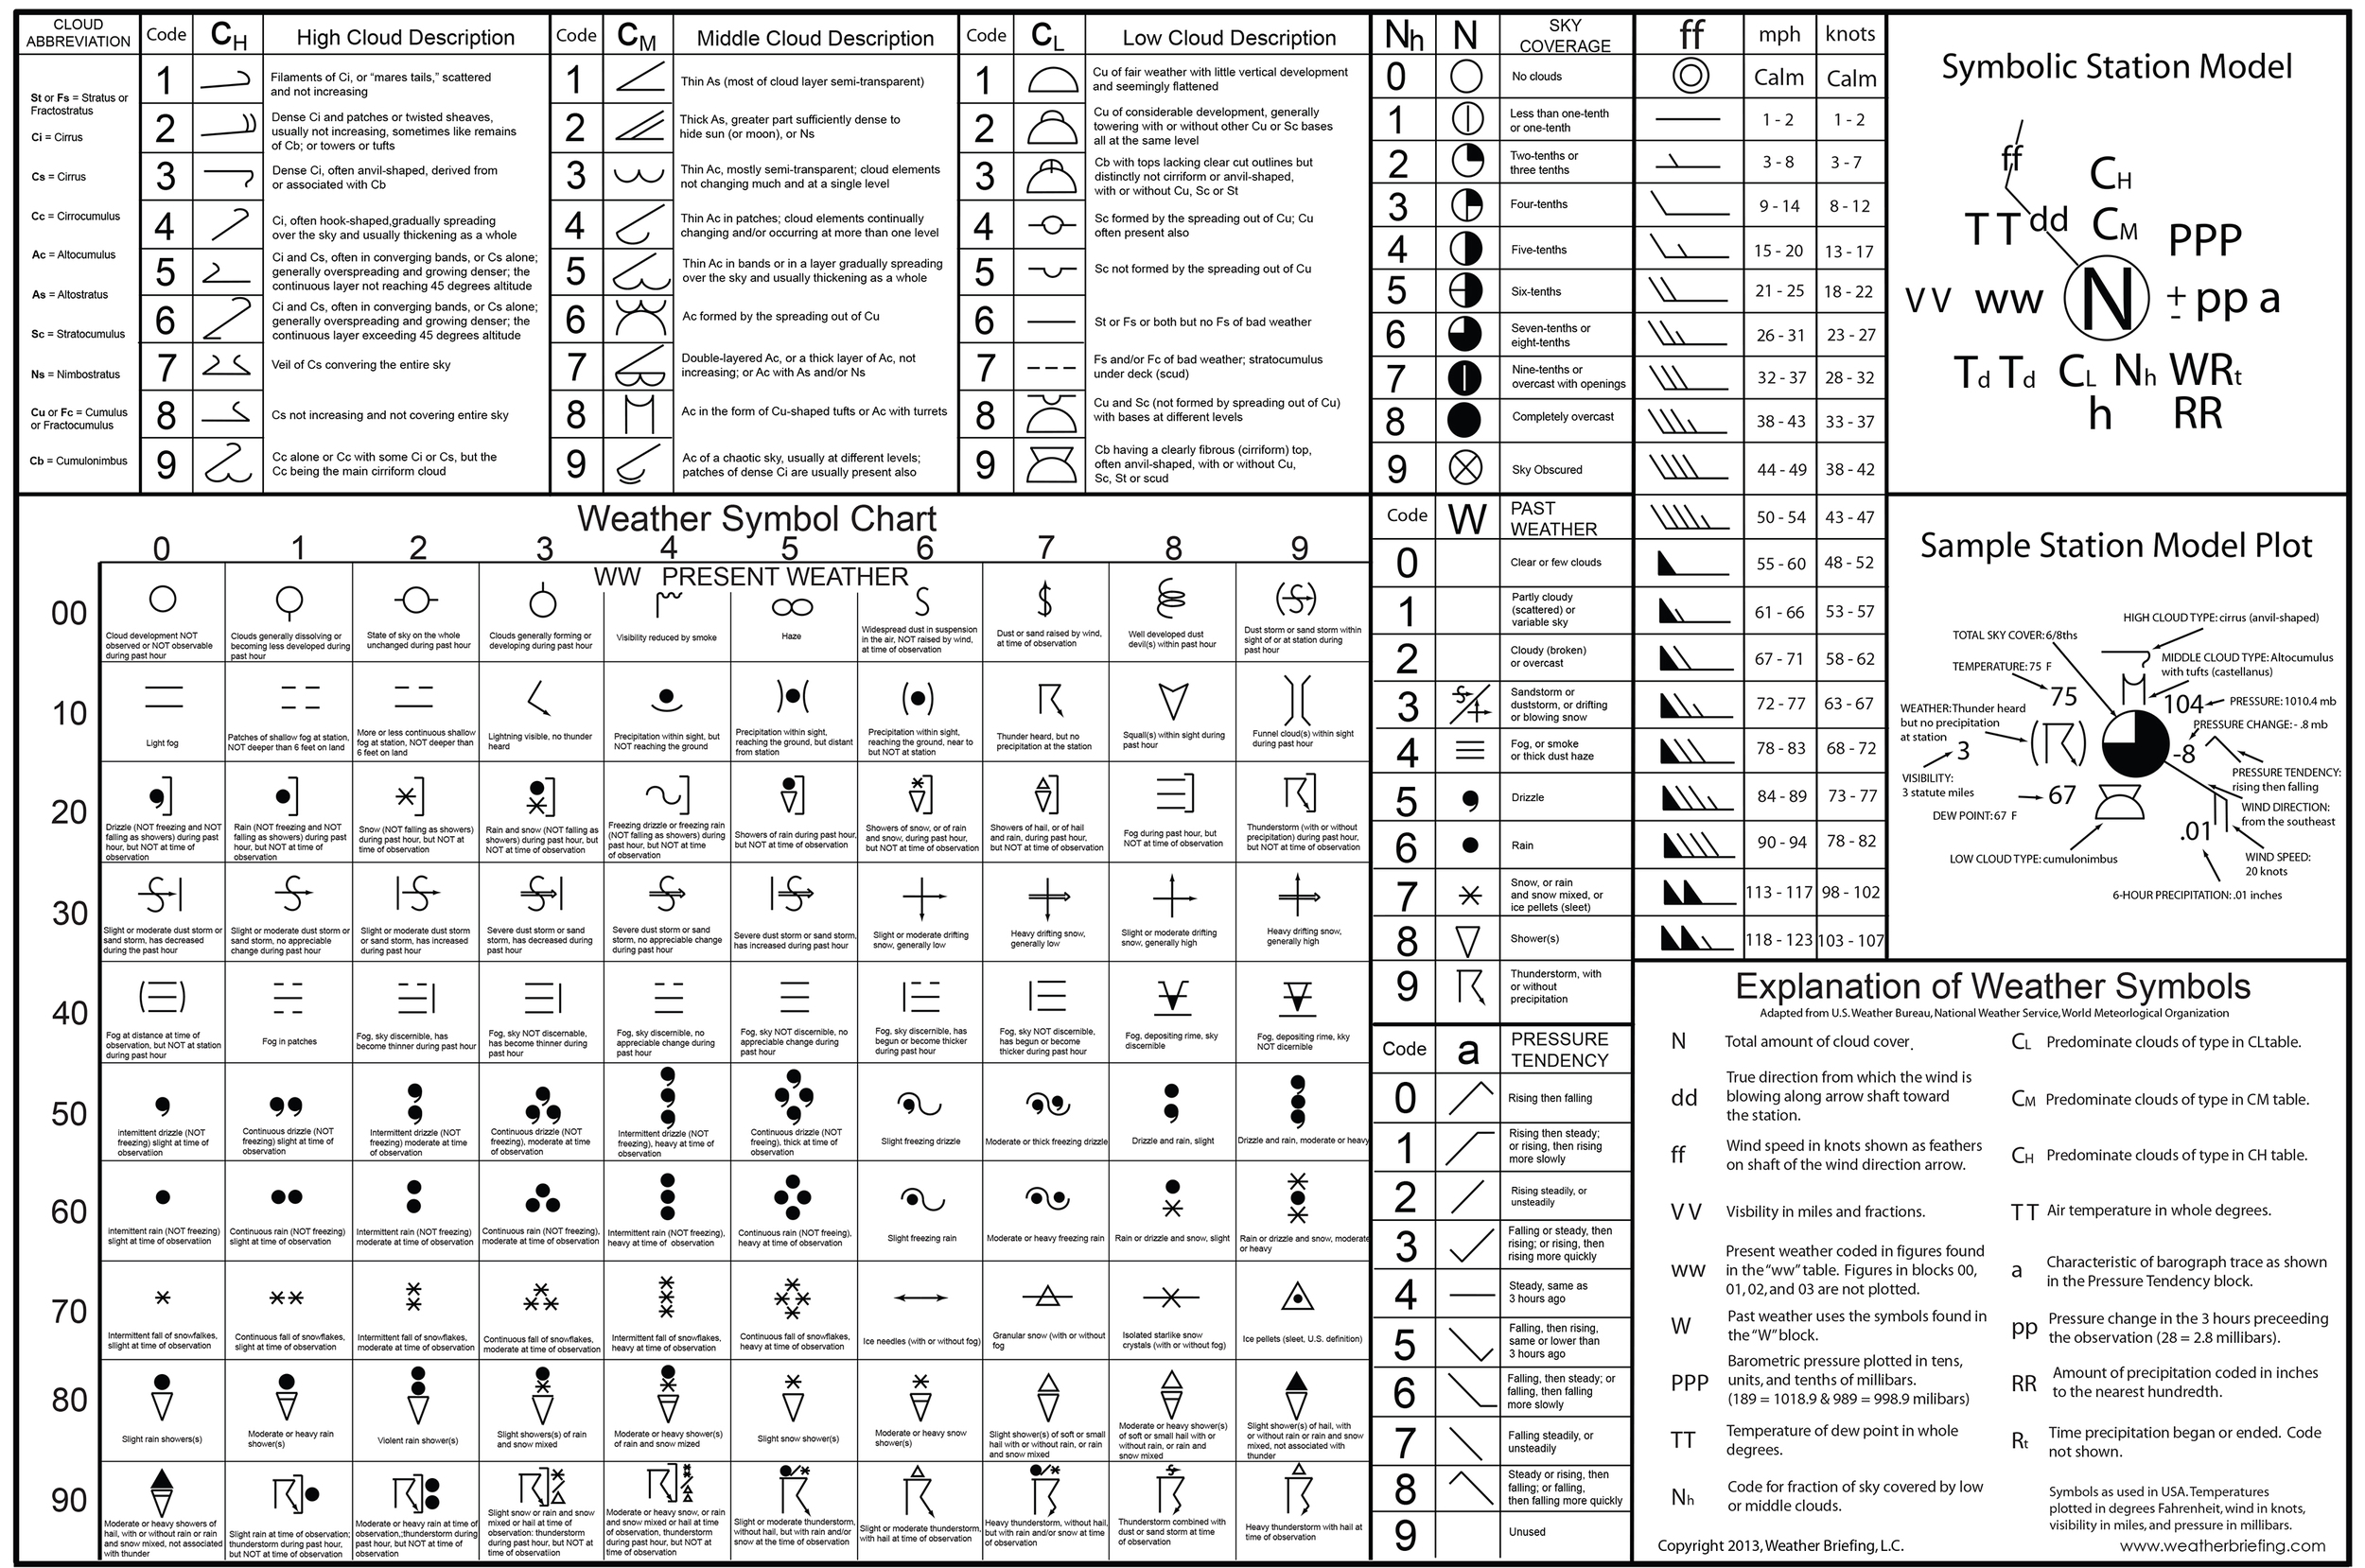
Weather Plotting Symbols
The Station Model Plot format is used by meteorologists as short-hand for plotting weather observations. The plots allow data to be organized and plotted into small spaces on weather maps. There is a wealth of information packed into each observation plotted.
An excellent data plotting program, Digital Atmosphere, may be downloaded at weathergraphics.com and is available for a trial period free of charge. It plots raw data freely available on the internet. It comes ready to use and is a favorite of amateurs and professionals.
Digital Atmosphere includes user defined mapping capability, has a large number of pre-drawn maps available, and includes many analysis routines that can be used by hobbyists, educators, and professional meteorologists. Surface and upper air data may be plotted and analyzed and the program includes many other options.
Do not forget that you can hand plot your own maps using your own or local data. For your own data use the Station Model Plot form above. It is free and allows you to plot your observations around a station circle. If you have your own instruments transfer your observations to the sheet and watch how the weather elements change. Use our weather symbol chart to plot symbols on the sheet including cloud types and current weather.
Go to the NWS Aviation Weather Center website and view the latest observations. Use the site to practice decoding.
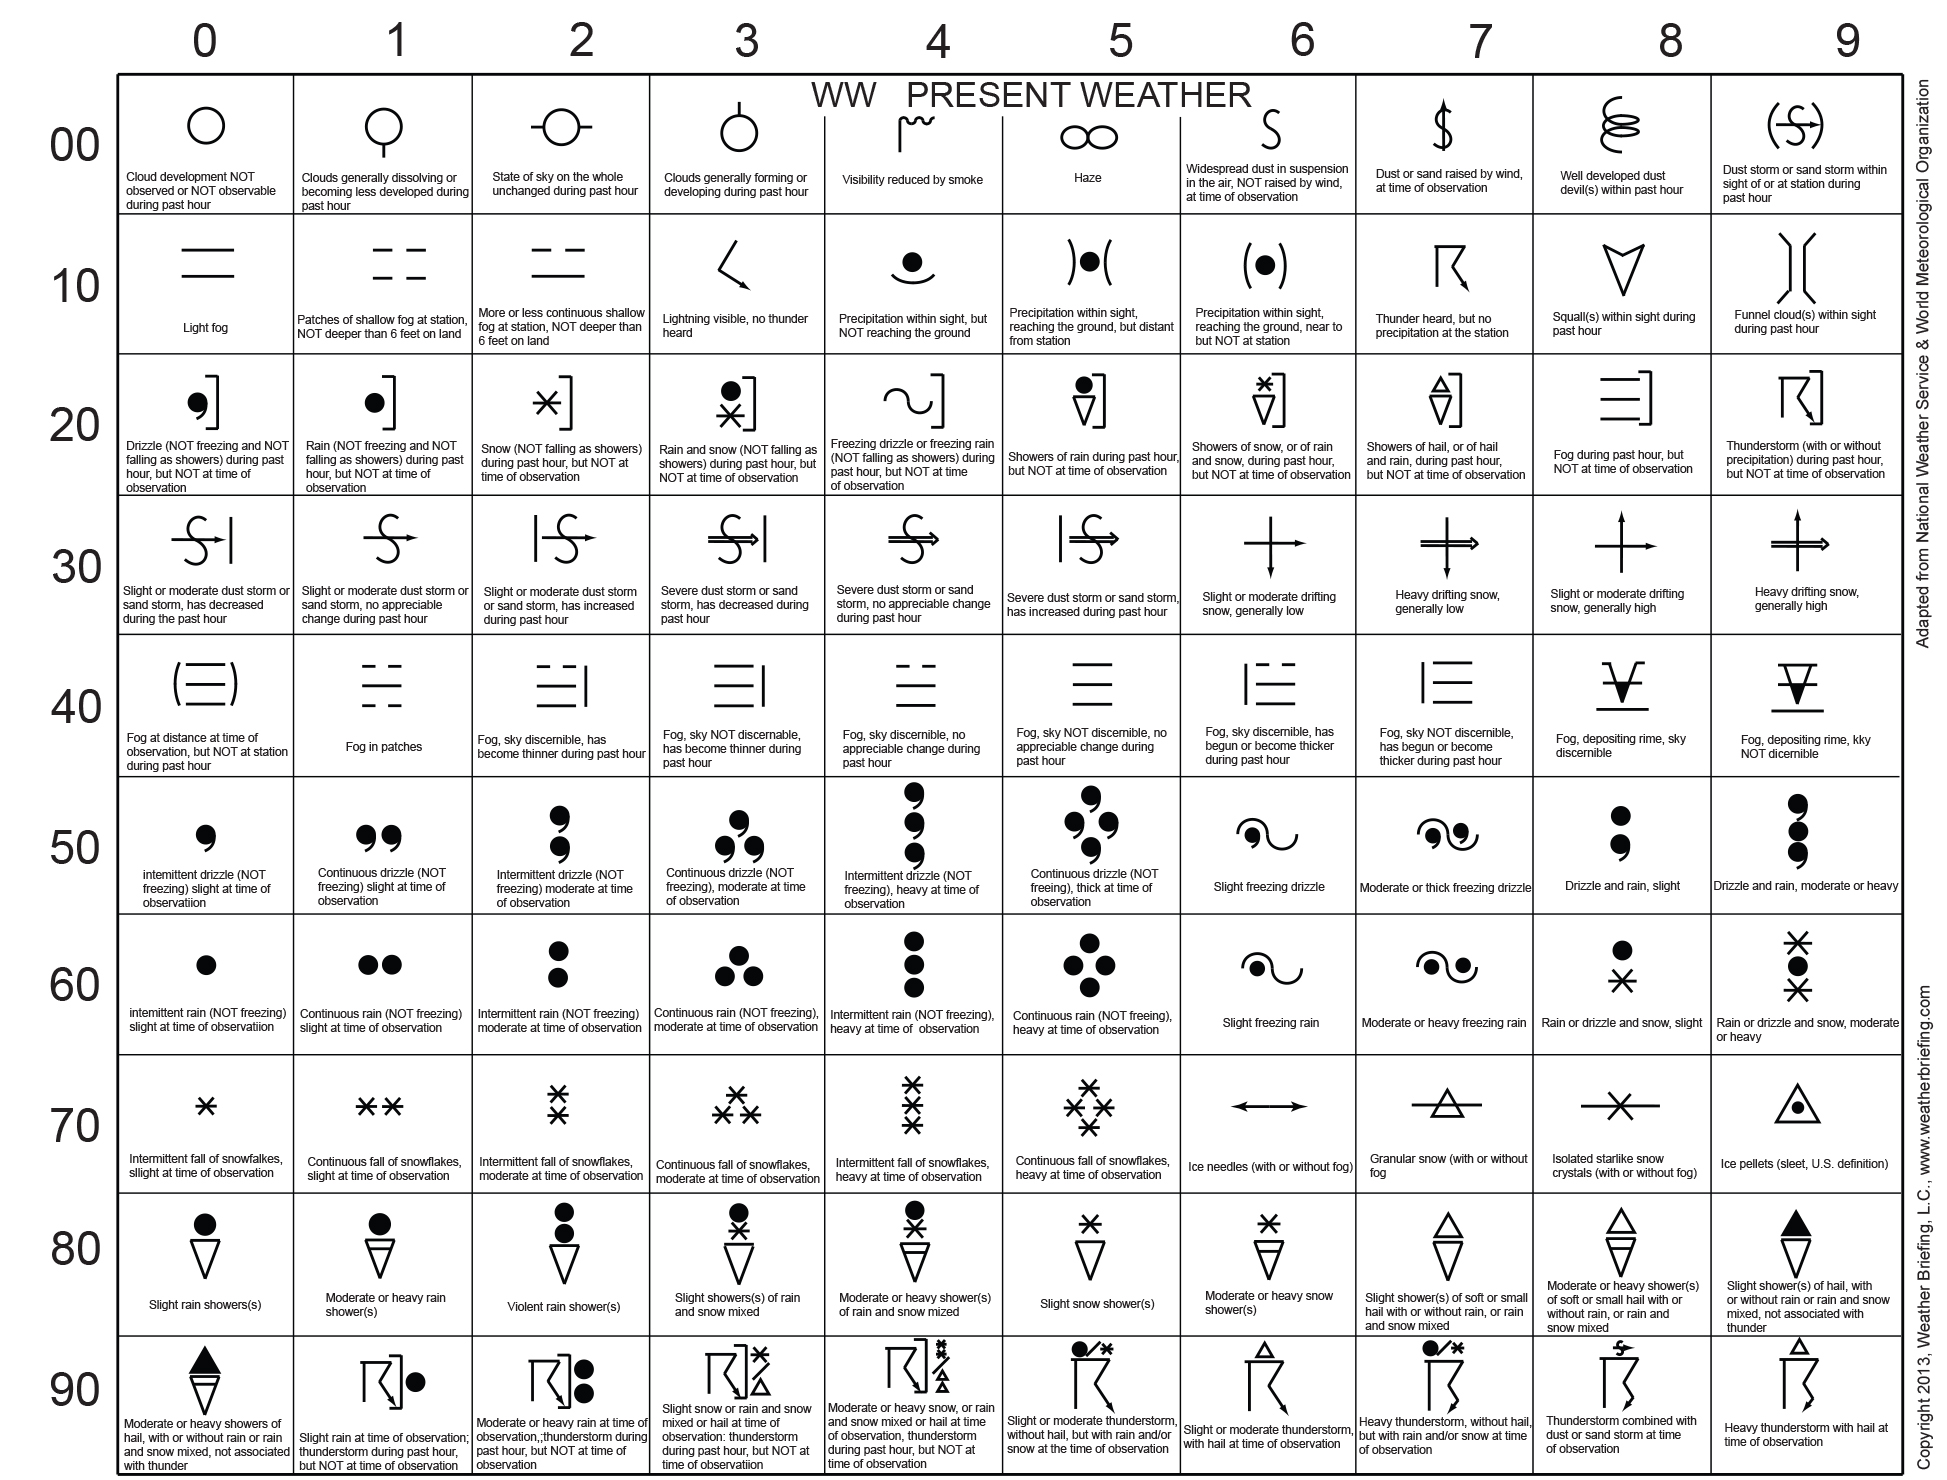
U.S. Weather Symbols
The chart of symbols below contains symbols used by the U.S. National Weather Service and meteorologists from around the world.
The symbols have been adapted from charts first published by the U.S. Weather Bureau and were available on the back of the large Daily Weather Map charts published daily and mailed by the U.S. Government Printing Office. The chart below is a re-creation of a chart I received in the 1960s that was printed on the back of select Daily Weather Maps. It is not an exact copy. The back of selected maps were either blank or included climate maps and other weather features. The charts were large, well done, and very informative.
Scroll down for samples of the Daily Weather Map from 1871, 1947, 1965, and 2020.
11" X 17" Black and White Chart.
The entire chart is 11” x 17”. Another option is to download and print sections of the chart on 8 1/2” x 11” paper. The individual 8 1/2” x 11” pages are found below.
Click the following button for symbols published in the World Meteorological Organization manual.
Symbolic Station Model Plot
The codes on the Symbolic Station Model plot correspond to the codes on the Weather Symbol Chart above.

Weather Symbols by Category
Print individual sections of the Weather Plotting Symbols full chart.
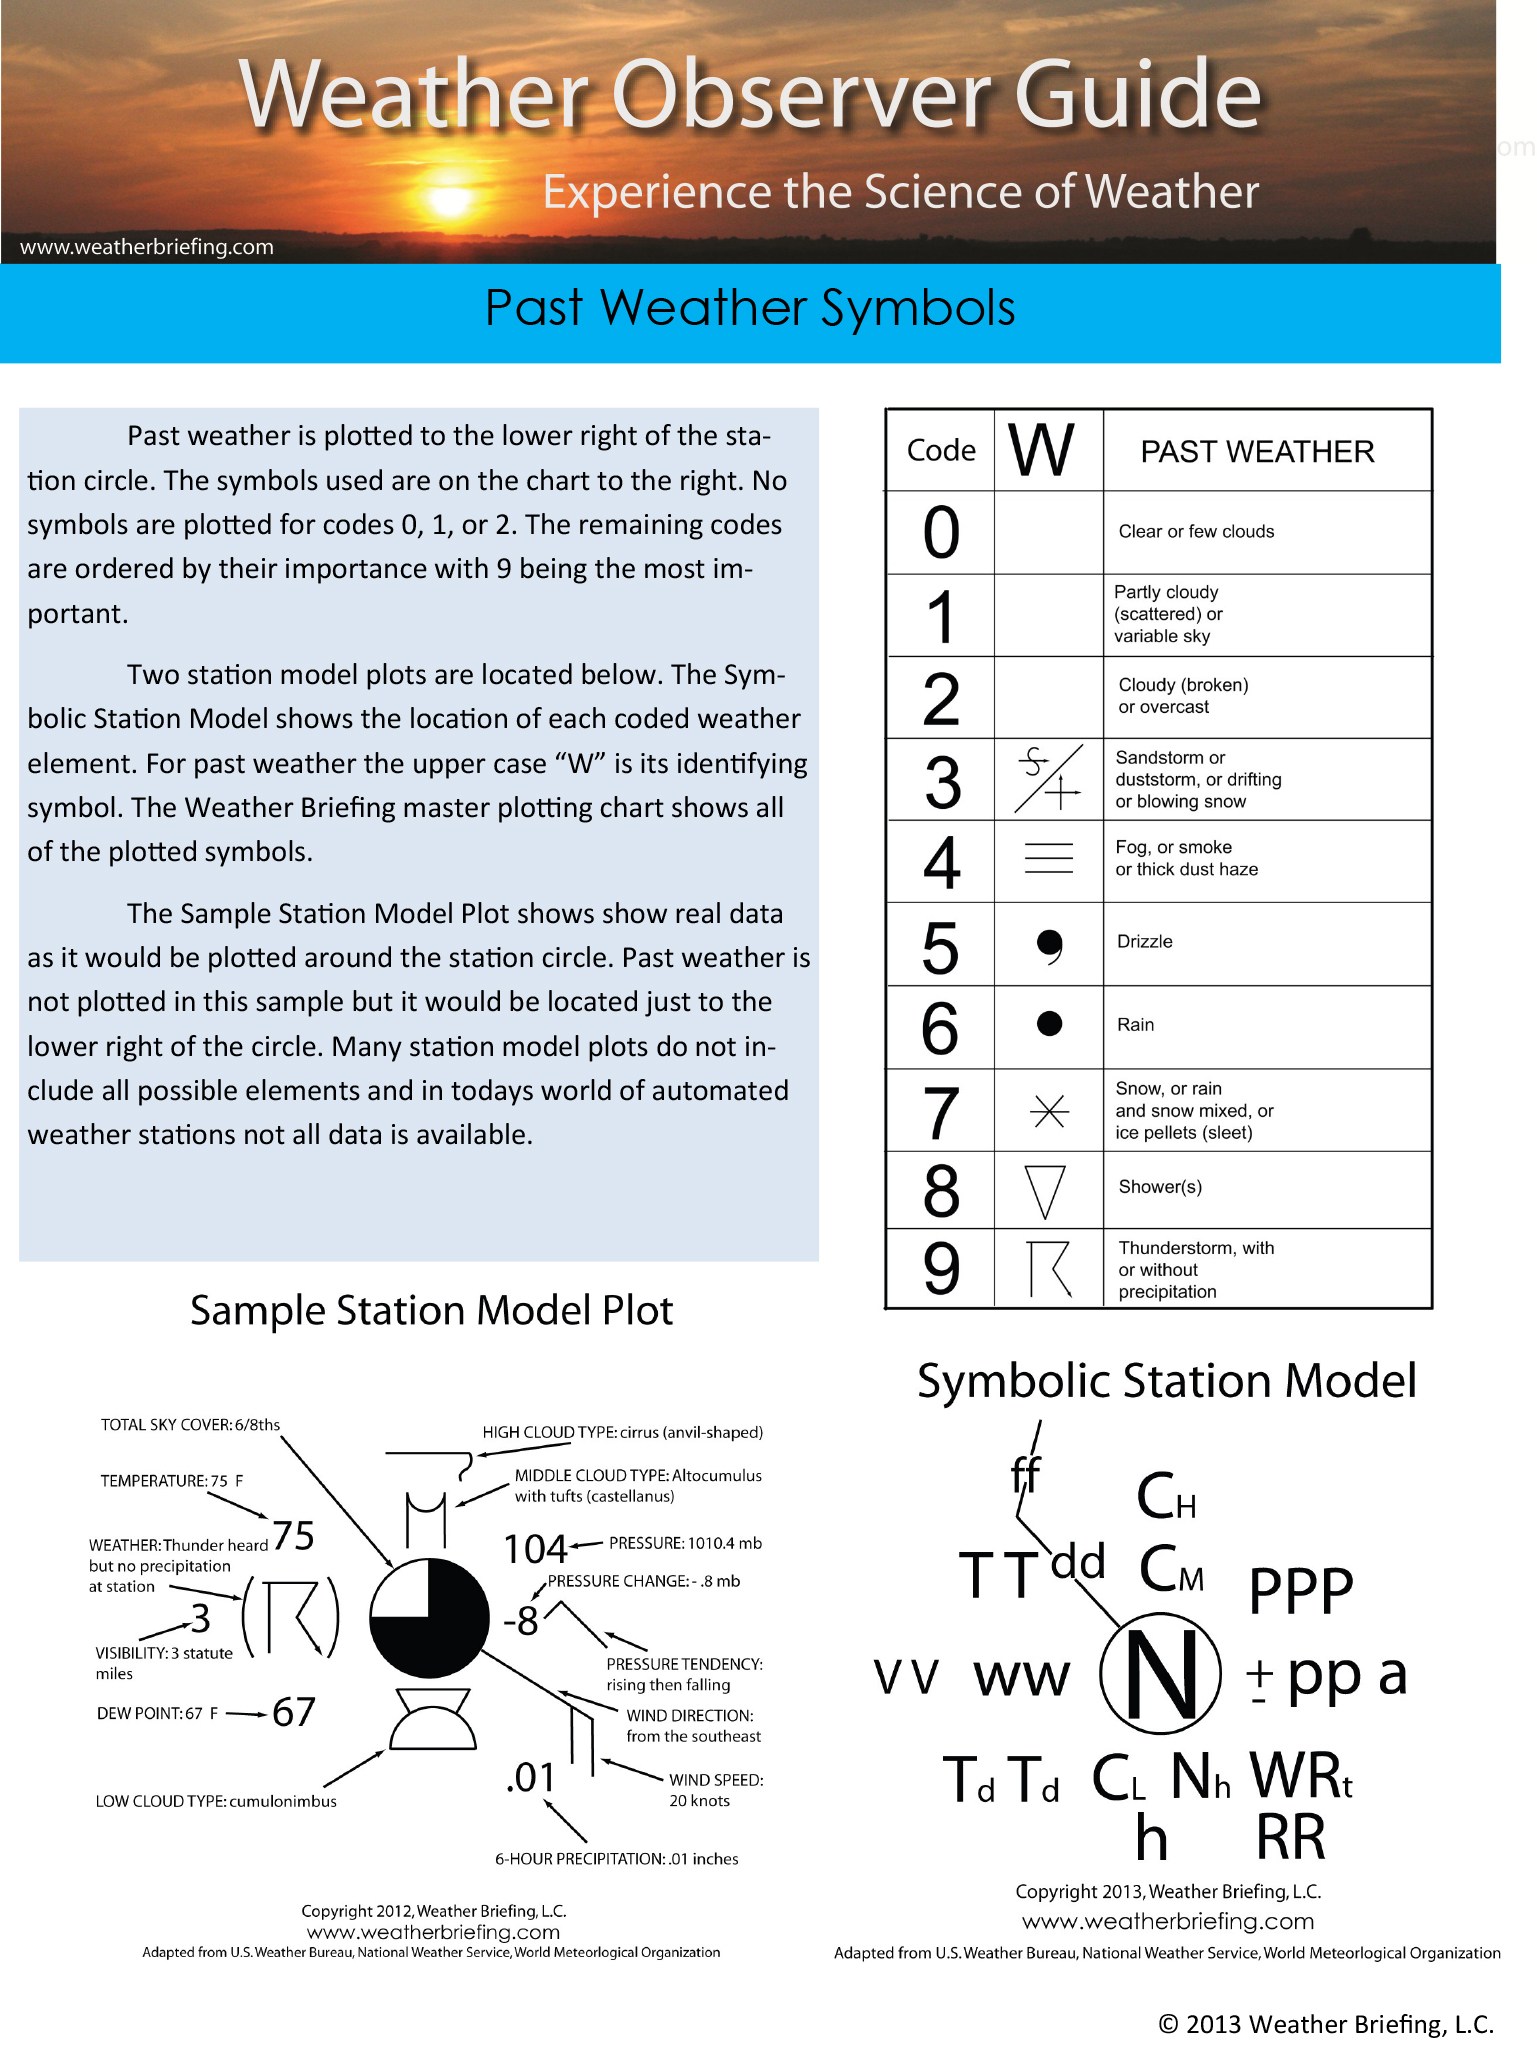
Past Weather Symbols
Sky Coverage Symbols

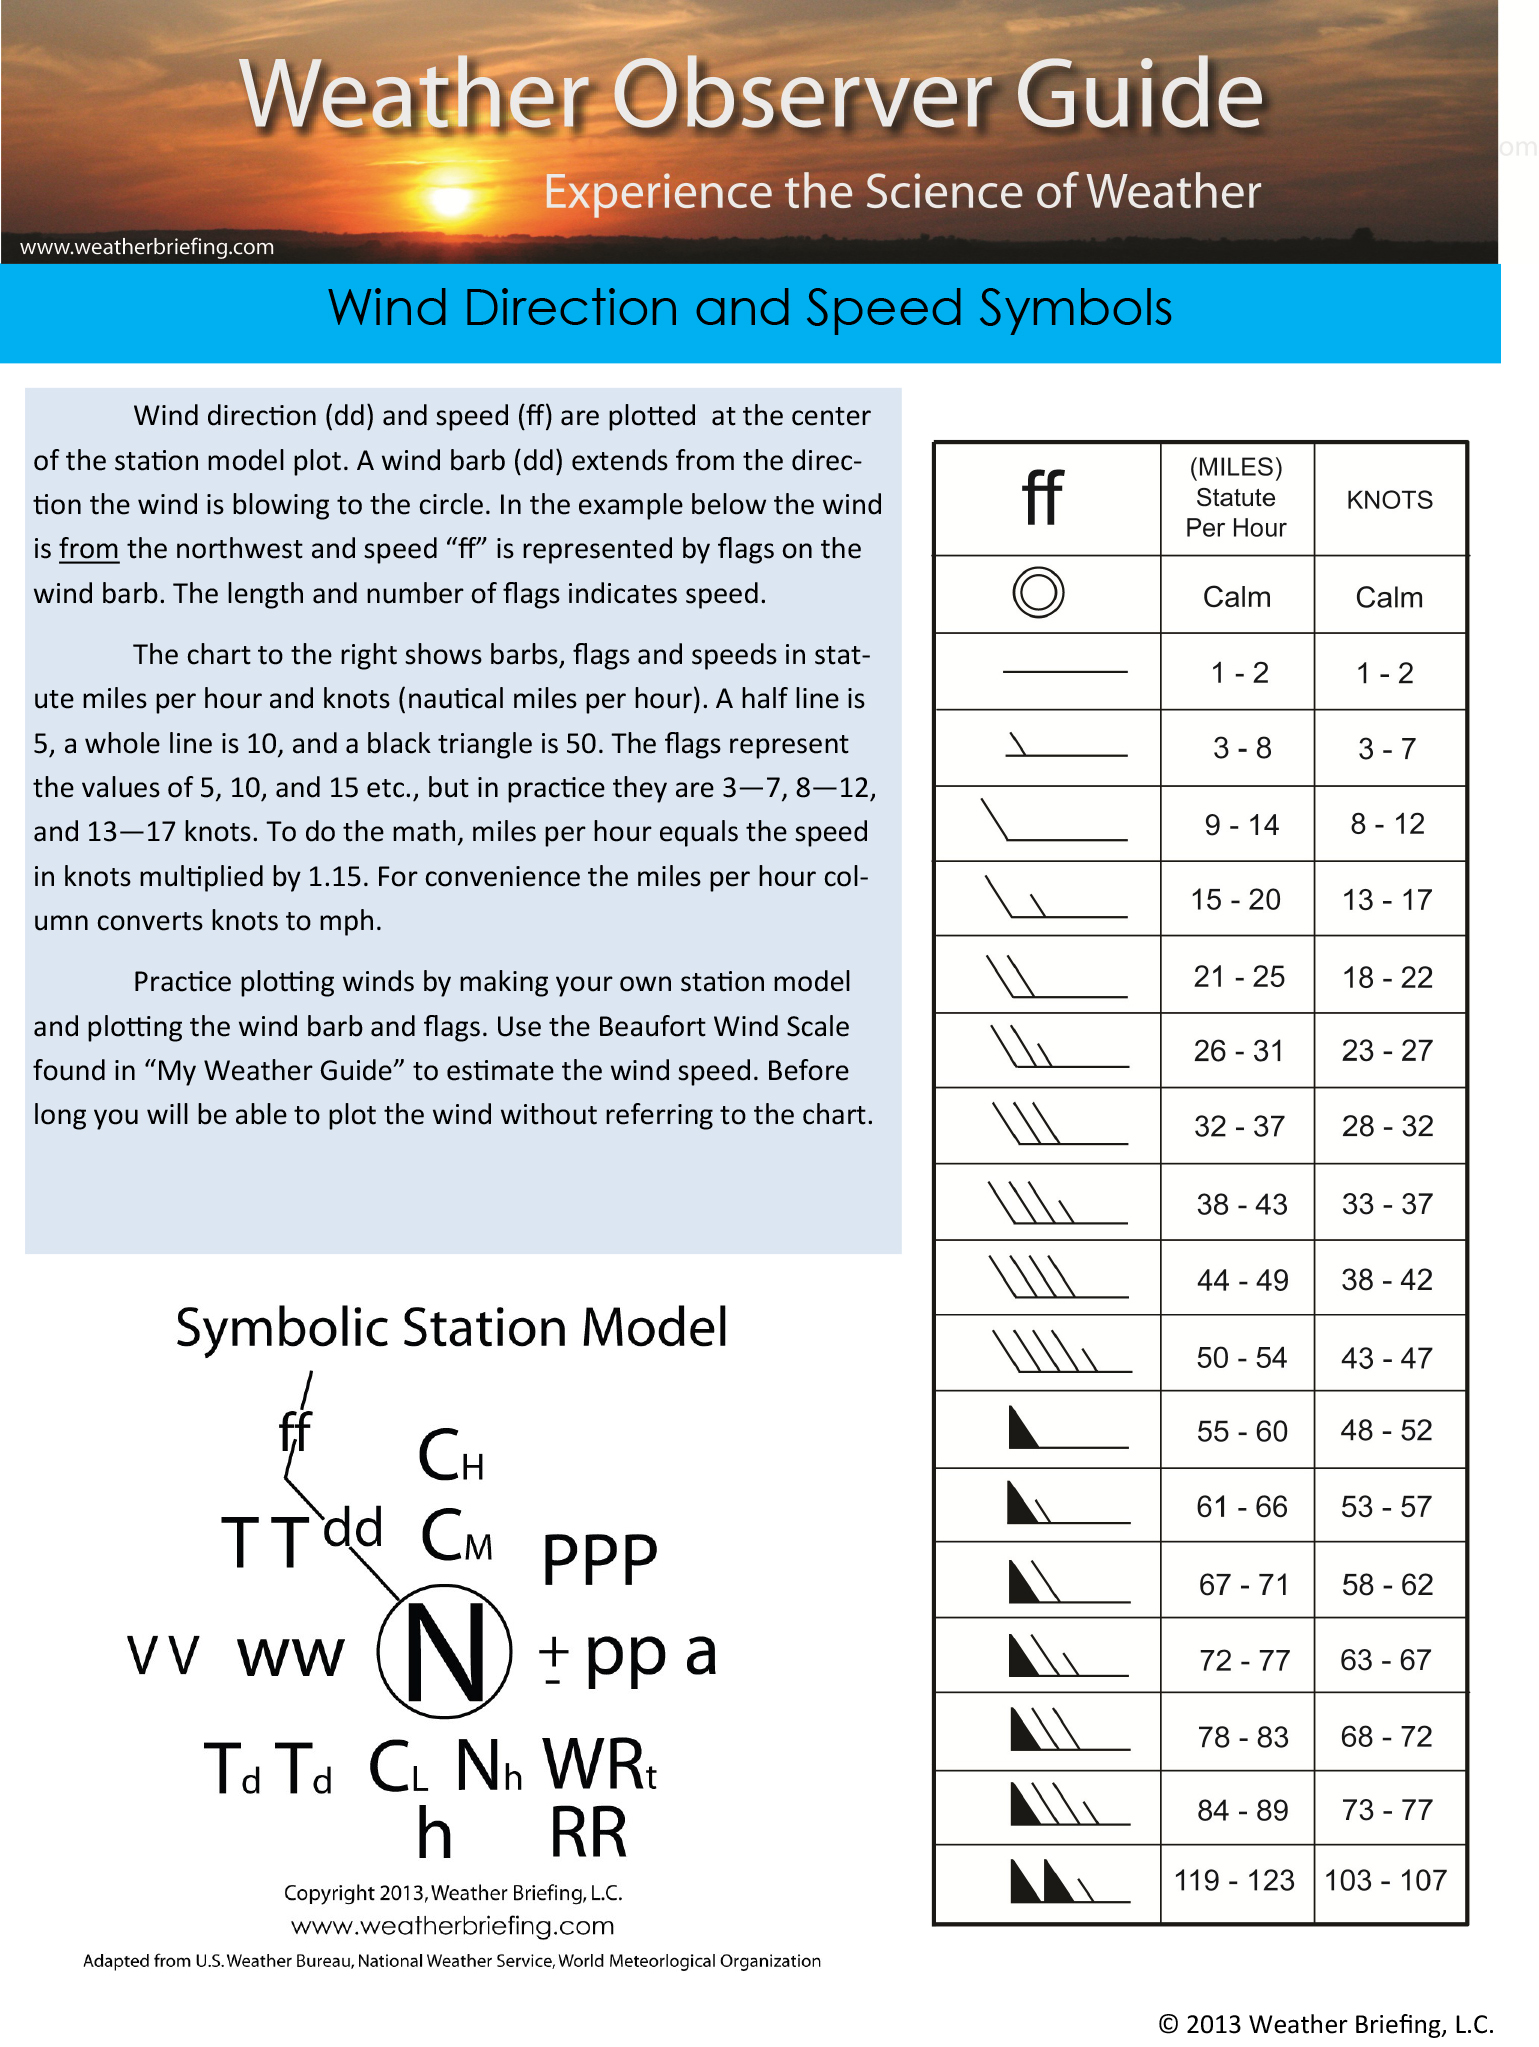
Wind Direction and Speed Symbols
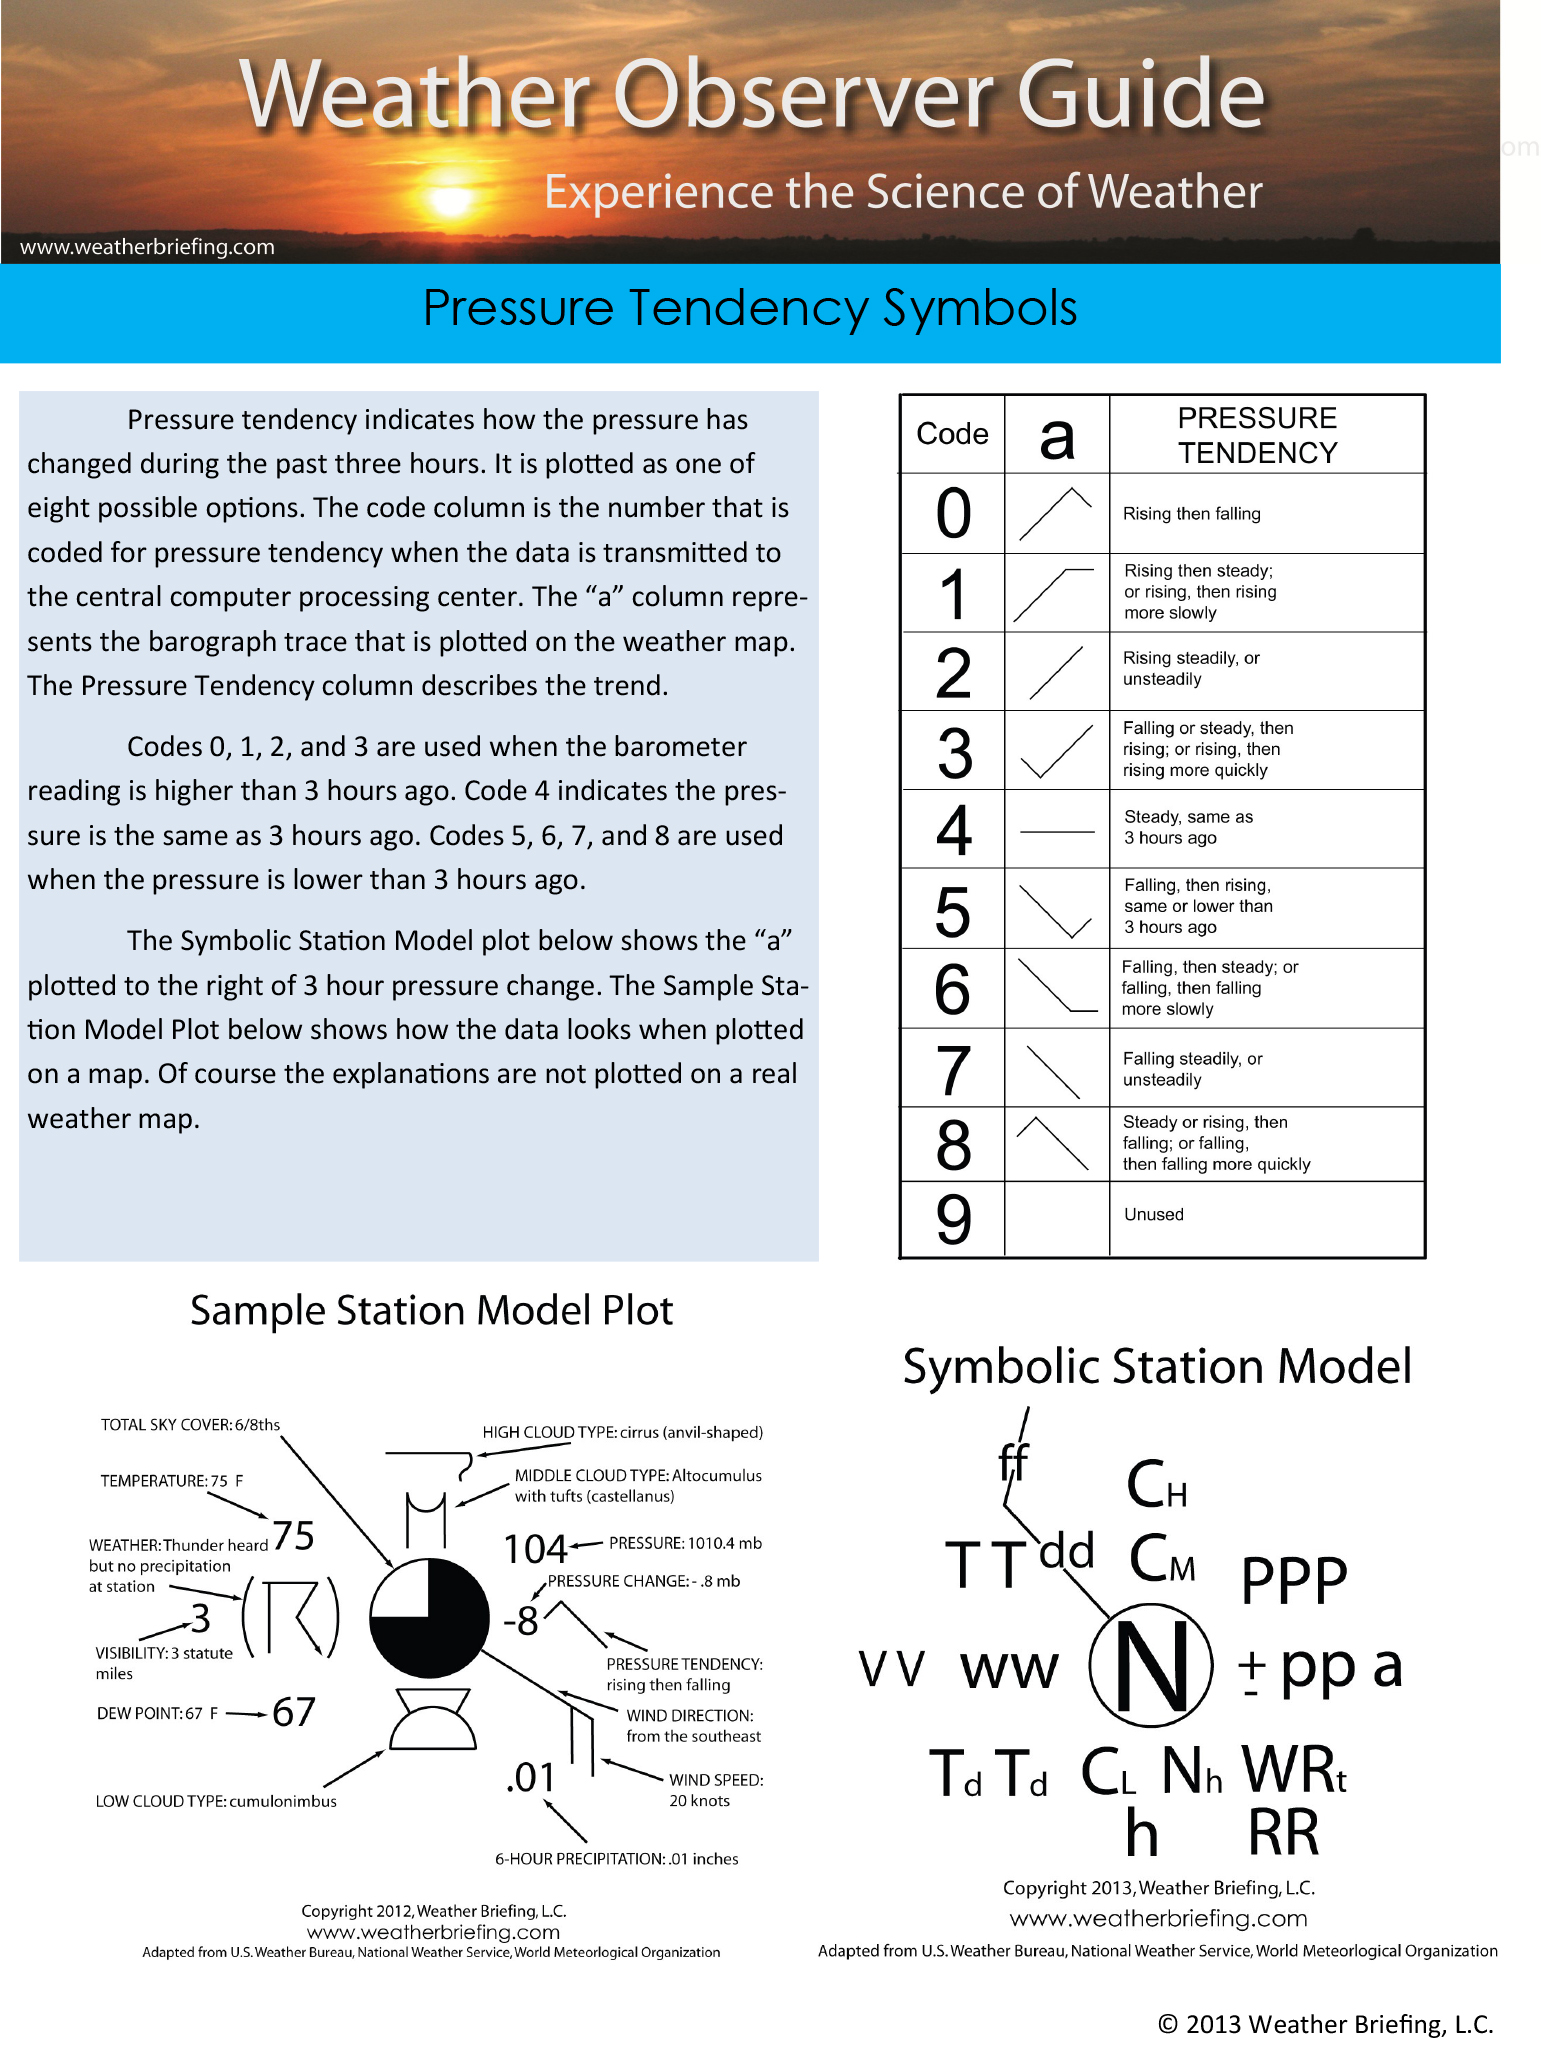
Pressure Tendency Symbols
Weather Observing Tips


Historical Weather Maps
These scans of old Daily Weather Maps show the progression of the map formats over select years. It is difficult to read the scans because the maps were faded. Use the link above go see all the scans. The maps here were cut in size to fit this webpage. The originals, while still faded, are a little easier to read. It is remarkable to see the changes in the number of stations available over the years and the change in formats. By 1947 (actually much sooner) the number of stations had grown considerably. There is not room to have all stations plotted on the map.
Maps January 1, 1871 to August 31, 2002 courtesy of NOAA Central Library. Maps beginning September 1, 2002 from the Weather Prediction Center.
January 1, 1871

December 12, 1947 - Front

December 12, 1947 - Back

June 1, 1965

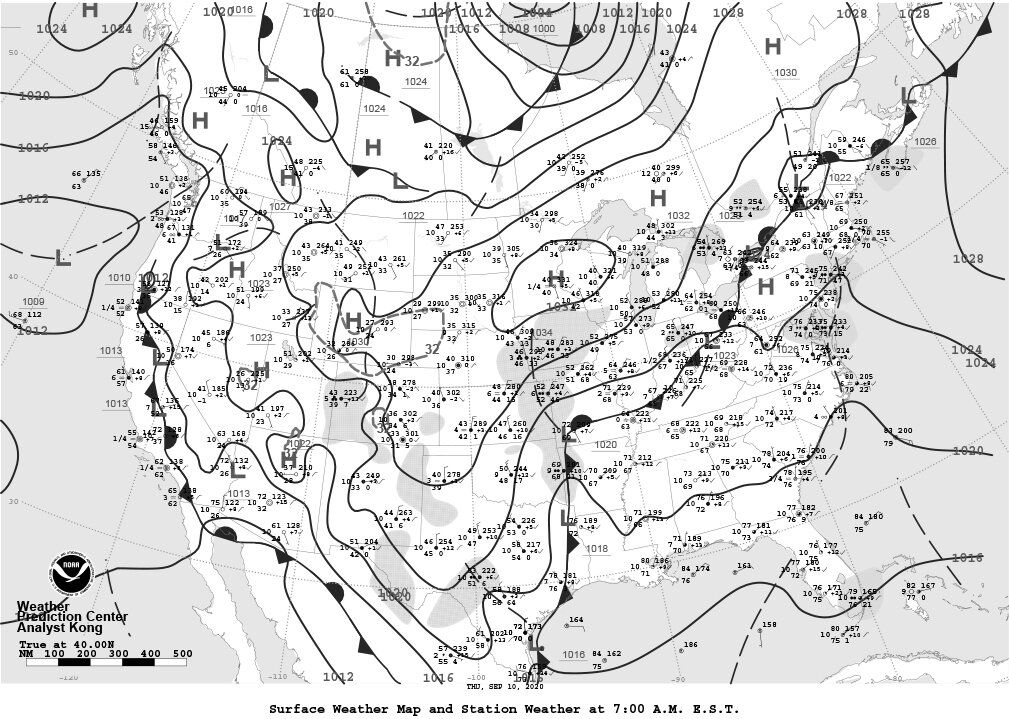
The next map is a sample of the Daily Weather Map since September 1, 2002. The maps are available from the Weather Prediction Center website HERE. The maps on the website are enhanced with more information available by clicking on each map.
September 10, 2020 - page 1
September 10, 2020 - page 2

Free Weather Observation Forms
Click on the buttons to download free observation form files.
Download and Print Free 8 1/2" x 11"
Weather Observing Forms
The fun in science occurs when our curiosity leads us to make discoveries. How do we feed our curiosity? By “hands-on” activities such as weather observing.
Weather Briefing offers free observing forms below. Just download the forms and get started. Start by using our Cloud Identification Chart to identify and keep a log of the clouds you see. Describe the clouds by their shape, color, size, and altitude. Watch how the clouds change. Enhance your observing by adding wind direction, wind speed, temperature, pressure, humidity, rain, snow - whatever interests you.
You may buy weather instruments or use the observations from the nearest weather station. Your observing does not need to be expensive. It’s a great way for children and adults to learn about a favorite topic of conversation - the weather.
Use our Station Model Plot Tutorial to decode weather map observations. Practice makes perfect!
Reverse the process by plotting your own data, either from your own instruments or from local official observations from www.weather.gov or other links found in “Your Weather Briefing” on our homepage. If you have time, plot your data hourly, especially when major weather systems affect your area. Be curious and observant. Your local library or websites will help you find the answers. The more answers you find the more questions you will ask and the more you will learn. That’s how science works.
