Click the button above for the latest 10-minute observation. If the page does not load and fill in all data, refresh the page.
If the observation does not auto-refresh after 15 minutes refresh the page.
Learn about Weather Stations
Weather Briefing maintains two weather stations. One station uses standard mercury and alcohol-in-glass thermometers housed in a standard Medium Cotton Region shelter. Rain and water content of snow is measured with the CoCoRaHS Network approved 4” rain gauge.
The second station is automated. It records and sends data to this web page. The station has live display capability on-site with 10 minute observations chosen for website display. The website display includes 2-day or 7-day graphs of 10-minute observations. Data is also saved in CSV format.

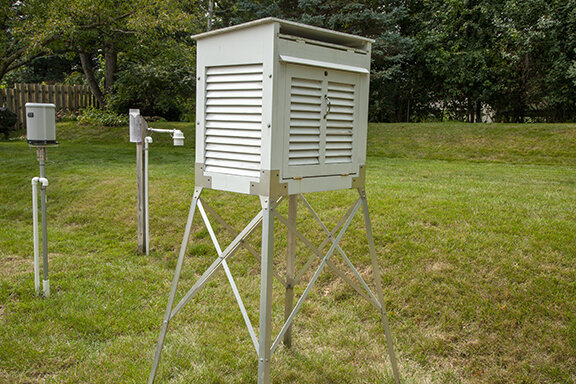
Medium cotton region shelter, siphon tipping bucket rain gauge in foreground with plastic COCORaHS rain gauge and TPH housing and sensors in background.

Wind Vane and Three-cup Anemometer
Click the blue button above to display the latest observation. If it has not auto-updated after 10 minutes refresh your browser. Always refresh your browser to see the latest graphs, forecast, and prior day weather summary. Frozen precipitation is not measured by the automatic rain gauge.
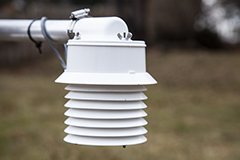
The aspirated shelter houses temperature, air pressure, and relative humidity sensors.
Standard Medium Cotton Region Shelter and Instruments
The standard weather station with manually read thermometers uses a standard Medium Cotton Region Shelter to shield the instrumentation from direct sunshine and precipitation. The louvered sides allow a free flow of air through the shelter and shades the instruments. The station measures maximum, minimum and current temperatures, and precipitation. The manual rain gauge is mounted on a 4 ft. post to meet CoCoRaHS standards. It measures rain and collects falling snow. The water content of the snow is measured by melting it. Snow depth is measured by averaging readings made with a measuring stick. .

Exterior of Standard Cotton Region Shelter

Max Thermometer (bottom) and Min Thermometer (top)

Minimum Thermometer show a low temperature of +1 F and current temperature of 11 F. Maximum thermeter is out of focus in the foreground.

INterior of Medium Cotton Region Shelter installed in 2014. Standard mercury-in-glass temperature left, minimum red alcohol-in-glass and maximum mercury-in-glass thermometers in the center. On the floor is a sling Psychrometer. Relative humidity is measured using the sling psychrometer. A consumer grade relative humidity dial is on mounted on the facing board at the right rear of the shelter.
Inside the Medium Cotton Region Shelter
A standard NWS mercury-in-glass thermometer is mounted vertically in the back left corner. It measures the current temperature.
Minimum Temperature: A red alcohol-in-glass thermometer is mounted in a Townsend Support on the cross bar. It is tilted slightly downward toward the bulb. When the temperature cools the alcohol contracts and surface tension drags a black index downward (left) in the tube. When the temperature warms the alcohol flows upward (right) around the index. The lowest temperature is marked by right end of the index.
Maximum Temperature: The maximum thermometer is mounted in the Townsend Support below the minimum thermometer. It is tilted down to the right. When the temperature rises the mercury is forced out through a constriction just above the bulb. When the temperature cools, the mercury cannot flow back through the constriction into the bulb.
The maximum and minimum thermometers are mounted on a Townsend Support. The tilt angles facilitate the measurement of the maximum and minimum temperatures. The upward tilt of the minimum thermometer helps the black index remain in place as the alcohol flows around the index when the temperature rises. The downward tilt of the maximum thermometer and the constriction above the bulb prevents the mercury from flowing back into the bulb when the temperature cools. The right end of the black index is the lowest temperature since the thermometer was reset.
The Townsend Support makes resetting the thermometers easy. To reset the minimum thermometer tilt it down to the right. The black index will slide to the right, down the tube and stop at the current temperature. The maximum thermometer must be spun to force the mercury past the constriction back into the bulb. When the thermometers are reset they both read the current temperature.
A Taylor sling psychrometer is also in the shelter. A sling psychrometer consists of two matched thermometers. The observer “slings” the thermometers (twirlers them in the air) using a circular hand/forearm motion. One bulb is dry (called the dry bulb thermometer) and the other has a wick dipped in water (the wet bulb thermometer). Water evaporates from the wick, cooling the wet bulb reading through evaporation. The drier the air the greater the cooling effect. The current dry and wet bulb temperatures are read directly and the relative humidity and dew point are computed using psychometric tables.
The shelter is a wood box with louvered sides. The purpose of the shelter is to keep the thermometers dry and in the shade. The shelter is naturally ventilated by the wind. The box is constructed with louvers angled down and away from the shelter box. There is also a double roof and a floor with holes drilled in it. The Medium Cotton Region Shelter is a standard shelter used at second order stations and at climatological substations.
The louvers and roof reflect sunlight and create openings that allow the free flow of air through the shelter. They also shade the instruments from direct sunlight. Direct sunlight measures the temperature of the thermometer with the Sun shining on it. Putting it in the shade measures the temperature of the air in contact with the thermometer. Keeping it dry prevents evaporation of water from the thermometer from reading too cool.
Compare how it feels to stand in the sun and in the shade and you will know why temperatures are measured in the shade. Thermometers in the shade measure the temperature of the air. Thermometers in the sun measure the temperature of sunlight directly warming the thermometer. The double roof creates a layer of insulating air between the roof and the interior of the box. It reduces heat from the top roof panel from entering the box below. The entire shelter is painted white for maximum reflection of sunlight to minimize the effects of solar heating of air inside the shelter.
Reading the actual air temperature is NOT easy to do. There are specific rules for how the shelters are designed and exposed to the weather. The Medium Cotton Region Shelter has been a standard way to expose thermometers. However, the naturally ventilated box painted white and with louvered sides depends on wind the naturally ventilate the box to give the best readings. Days with little or no wind and sunshine will produce readings that are warmer than the same day with wind greater than 5 mph. The solution is an aspirated shelter. Some shelter boxes have been aspirated and newer designs for exposure are now also in use. See the automated weather station description to learn more.
The shelter box is also mounted on legs which place the base of the shelter 4 feet above ground level. The thermometers are to be mounted between 4 feet 1 inch and 6 feet 7 inches above the ground and located over natural vegetation in direct sunlight. The thermometers in this shelter are 6 feet above the ground.
CoCoRaHS Rain Gauge
CoCoRaHS (pronounced KO-ko-rozz) is a grassroots volunteer network of backyard weather observers of all ages and backgrounds working together to measure and map precipitation (rain, hail and snow) in their local communities.
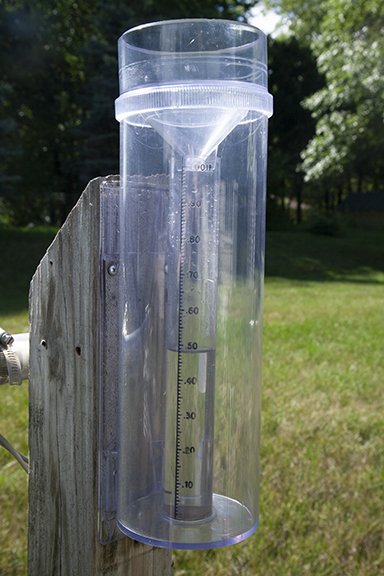
The standard rain gauge is a NWS/CoCoRaHS approved 4” diameter rain gauge. The opening is smaller than the official NWS 8-inch gauge. The CoCoRaHS 4 inch gauge includes the 4” outer cylinder and a 1” diameter inner cylinder. The two cylinders are the key to how the gauge measures rain to the nearest .01 inch. The area of the outer cylinder opening is 10 times larger than the area of the inner cylinder. This expands the depth of the water in the inner cylinder 10 times.
The photo shows how the parts are assembled. The funnel catches the rain which drains into the inner cylinder. One inch of rain collected by the funnel opening becomes 10 inches in the inner cylinder and .1” (point one inch) becomes 1” in the inner cylinder. If more than one inch accumulates the inner cylinder overflows into the outer cylinder.
A study done for the CoCoRaHS Network found that the accuracy of the 4' inch gauge is similar to the NWS standard 8 inch gauge and is much less expensive. The gauge cannot measure snow depth but it is able to measure the water content of snow by collecting falling snow, melting it, and pouring the water into the inner cylinder. To capture snow the funnel top and inner cylinder are removed.
Reading Your Rain Gauge
Reading your rain gauge is easy if you know how the gauge works and how to read it.
The CoCoRaHS rain gauge has three parts; a 4 inch diameter funnel at the top, an outer cylinder and an inner cylinder. The funnel fits over the top of the outer cylinder and inside the opening of the inner cylinder (see the top photo). It has a graduated scale with zero at the bottom and 1.00 inch at the top with markings for each .10 (tenth of an inch) and .01 (one-hundredth of an inch) on the inner cylinder. The area of the widest funnel opening and the outer cylinder opening is 10 times the area of the inner cylinder opening. The water collected by the top of the gauge is funneled into the smaller inner cylinder.
Because the water collected at the top of the gauge is 10 times what would be caught by the inner cylinder alone the height of the water column in the inner cylinder is 10 times deeper that what it would be in the outer cylinder. That means 1 inch of rain is ‘stretched’ into a column 10 inches tall in the inner cylinder. Each inch of the water column in the inner cylinder equals .10 (one-tenth) of an inch of rain. When the inner cylinder is full it is a column of water 10 inches high which equals 1.00 ( one inch) of rain.
CoCoRaHS Approved Rain Gauge
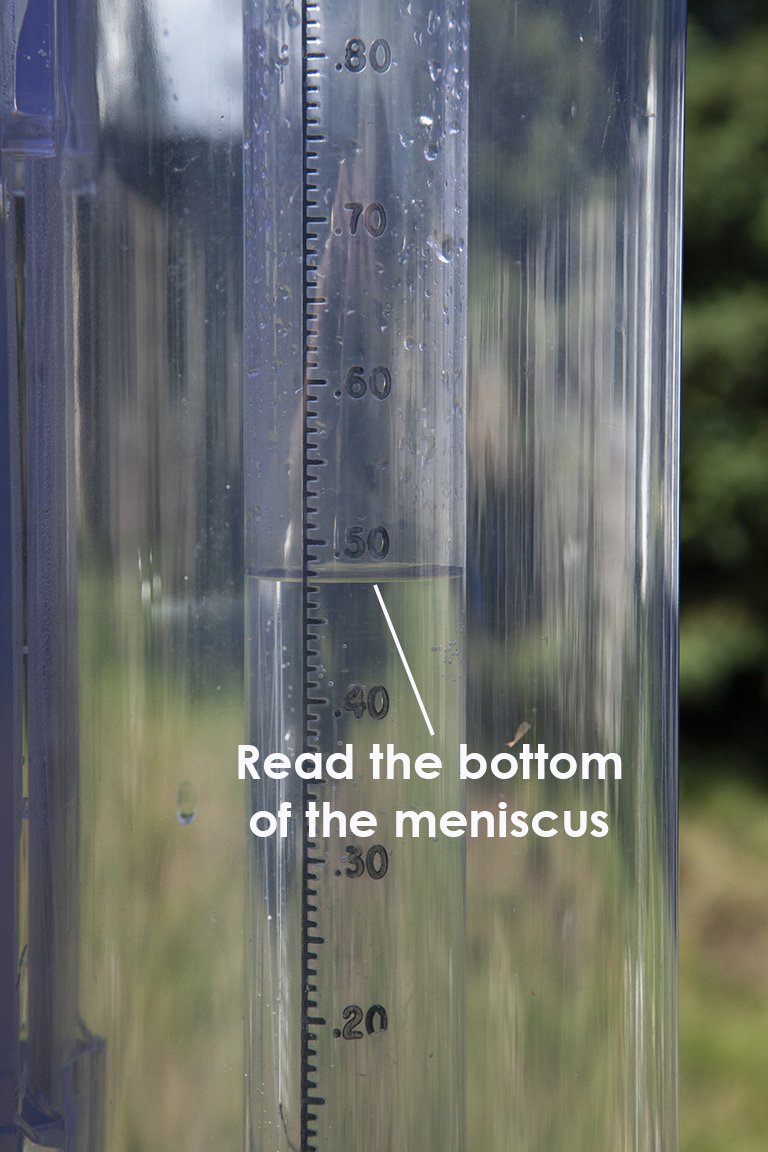
IMPORTANT: To read the height of water in the inner cylinder be sure to read the lower edge of the water at the top of the column. Due to the surface tension water is pulled up around the edge of the inner cylinder. The surface of the water column curves down from the edges to the center. It is called the meniscus. The height of the water is read the bottom of the meniscus. See the rain gauge close-up photo.
If rainfall is more than 1 inch, water in the inner cylinder overflows into the outer cylinder. To measure more than 1 inch empty the inner cylinder and then pour the overflow water from the outer cylinder into the inner cylinder, read the total, and add the amount to 1.00 inches. For example if the inner cylinder is full, empty it. Note the amount which would be 1 inch of the tube is full. Pour the remaining rain in the outer cylinder into the inner cylinder. If it measured .27 inches your total rain would be 1.00 inches + .27 inches = 1.27 inches.
If you have more water in the outer cylinder repeat the process again, and again as necessary.
HINT: When pouring the water from the outer cylinder into the inner cylinder be sure to carefully place the funnel inside the opening of the inner cylinder. Pour a steady stream of water into the funnel cylinder. if it gets close to the top of the inner cylinder, STOP pouring before it overflows. It will take some practice to avoid spilling any water. Practice this until you are comfortable with the procedure. To avoid overfilling stop adding water before it overflows. IMPORTANT: Write down each measurement when you empty the inner cylinder so you do not forget the amount(s).
Automated Weather Station
The automated weather station measures air temperature, 4-inch depth soil temperature, relative humidity, pressure, wind direction, wind speed, rainfall, and solar radiation. It is a high quality station manufactured by Dyacon. The station computes dew point, using the temperature and relative humidity readings. The station updates the web page automatically every 10-minutes. We have a live display on-site. The webpage includes meteographs which are graphs of the past two or seven days. These charts provide a record of the observations for the past 48 hours or the past 7 days - you decide which format to use. The stations stores the observations at a time resolution determined by the observer.

Automated Rain gauge in the Foreground.

Wind Vane and Three-cup Anemometer

Left: Temperature, Relative Humidity, and Pressure Sensors. Right: Tipping Bucket Rain Gauge - Siphon design.
Siting the Stations
The Weather Briefing weather stations are located in a residential area. The urban location does not meet NWS siting standards, which are supposed to represent surface conditions where the air can freely circulate free from non-meteorological factors. In an attempt to compensate for our urban location we have taken care to locate the sensors on the property to minimize urban influences on instrument readings. Homes, trees, streets, and other structures in urban areas may make readings non-representative of the free air. Official weather stations around the world suffer from this problem where cities have grown up around observing sites that were originally rural. At our site we have identified that wind speed and wind direction measurements are most effected. There are lesser effects on rainfall, relative humidity, and temperature. The instrumentation in this weather station is of high quality and accuracy.
The accuracy of any weather station is determined by the sensor quality and its exposure. For weather hobbyists the most important factor in your measurements will likely be it’s location. There are many good weather stations at different price points on the market that will work for the casual observers and serious amateurs. You do not need to give an arm or a leg to get a station that will serve your needs. Temperature sensors should be kept dry and well ventilated (in the shade).
A business, research station, airport, or other locations where high quality reliable data is required need professional set-ups. The type of instrumentation and exposure will be critical to success. In those situations improper exposure will more than off-set money spent for high quality instruments. Read on to see how exposure affects the readings.
Weather Station Accuracy
Accuracy is how close a measurement is to the real value of what is being measured. The most accurate sensor in the world will not perform to its potential if it is improperly exposed. A sensor may be improperly exposed by placing it in the wrong location and/or by not correctly sheltering the sensor properly.
Here are a few examples.
Exposing Official National Weather Service Instrumentation
Weather data is collected for a variety of purposes. Meteorologists use data for research and forecasting. Many of the meteorological uses require data that represents conditions in the free air - free from man-made influences. The standards for measuring and reporting weather conditions at meteorological stations are expected to follow strict standards that must be maintained. This includes collecting data for weather and climate networks. The type of instrumentation, its maintenance, exposure, and observation regulations are standardized so the data is comparable across the network. Weather forecasting, aviation, research, and climate, are only a few examples of endeavors that require these standards.
For example, air temperatures measured over or near concrete may be 5 to 20 degrees warmer than readings over grass - at the same location. What is the temperature? The difference is caused by heat absorption characteristics of concrete - not the weather. Wind measurements taken in a grove of trees would not represent the wind in the free air. The purpose for taking the readings determines where and how instrumentation should be exposed. A research study might want to measure the air temperature over concrete but using that same data for climate observations would not be appropriate.
What would a poor exposure look like for weather observations? Instrumentation located over or near concrete or asphalt parking lots, streets, and sidewalks. Buildings, air conditioning or heat vents, or instruments located on roof-tops or near any man-made structures make readings non-representative of local weather. Thermometers exposed to direct sunlight measure the temperature of the sunlight warming the thermometer not the temperature of the air. Poor exposures impact temperature, wind, relative humidity, precipitation, and soil temperatures. Comparing data from two poorly sited stations is useless.
Exposing Instrumentation in Other Locations
In our example above, an official weather station must be located to measure natural weather conditions. However, there are reasons we might want exposures in “non-standard” locations. If the purpose is to determine temperatures in an agricultural crop canopy, the sensors might be placed in or above the canopy - not an “official” installation for meteorologists but exactly right for agronomists. There are many other examples of specialized installations not acceptable for meteorological purposes but are necessary for other research.
Instrument Shelters
For meteorological purposes thermometers are exposes in a Medium Cotton Region Shelter or in aspirated shelters. These two methods of exposure are used in the weather stations described on this website. The Medium Cotton Region Shelter is still in use around the world and is naturally ventilated. Air passes through the louvered sides through natural air flow. An aspirated shelter, used with our automatic weather station, uses a fan to keep the shelter ventilated at all times. Sunlight shining on non-aspirated shelters when winds are light will cause the air in the shelter to be warmer than the free air. In those conditions an aspirated shelter will provide a cooler reading than the Medium Cotton Region Shelter.
The Medium Cotton Region Shelter also has much more mass than an aspirated shelter. There is a lag time for all the air inside the shelter to be exchanged with the outside air and for the temperature of the shelter box to change to the outside temperature. This means the thermometers inside the shelter will register the changing temperature of the outside air at a slower rate than aspirated shelters. Also, mercury and alcohol thermometers do not record temperature change as fast as the electronic temperature sensor. For those reasons aspirated sheltered electronic sensors respond faster to temperature change.
When someone wants to know what the temperature is remember - it depends on how and where the temperature is being measured.
Weather Hobbyists
Weather hobbyists are seldom blessed with the perfect location for their weather instruments. Residential areas have homes, streets, driveways, decks, patios, and other structures that weather instrument measurements. Should the hobbyist decide not to install a weather station because exposure is not perfect for a weather observation? The answer is no. Measure what you want, keeping in mind what you are measuring - the conditions at your location. Your readings will not match the official readings but neither do official readings represent conditions at your location. The standards for official weather stations are needed so data at each station represents the conditions of the atmosphere there and so it can be compared with other official stations. Read the ‘Report on Siting of Weather Stations’ below to see why that is important.
A better solution might involve understanding what conditions alter your measurements and then site your instruments to minimize those issues. Whether your readings are “off” a little when compared to official sites would not alter how you enjoy the hobby. In most cases your readings will be very useful. In our case, at Weather Briefing, wind measured on a rooftop in an area with numerous trees significantly affects what is measured. We end up with lower wind speeds than a location in the open countryside. Concrete slabs may affect your temperature readings. Locate your temperature sensor(s) as far away from the concrete and other things that affect temperature readings.
Next, please read about official exposure standards and then a study about weather station exposures that have been contaminated. You will learn about good exposures and poorly sited weather stations. Also go to the Climate Products & Data section on the home page to learn about the Climate Reference Network that has been installed in the United States. It was installed to provide uncontaminated weather data. Finally, below there is a research study about two different rain gauges.
Above all, enjoy your hobby. Do your best to site your instruments for what you want to know and your convenience to do any maintenance. You probably do not live at the airport and you are not responsible for safe landings and take-offs. Their purpose for weather instrumentation is different than yours. Enjoy!
The Weather Briefing station is located in a residential area of Cedar Falls, Iowa. Readings are influenced by trees, rolling terrain, driveways, streets, and homes. The location is just below the crest of a hill located to the north and west. About 180 feet to the east there is a north - south concrete street. The area also has grass lawns, bushes. stone walls, and a few small utility structures and fences. Observations represent what would be found in a residential area, which are different from the open countryside.
By now you might be wondering why even bother having a weather station? Except for wind speed the differences between here and the open countryside are not substantial for our purposes. Would this site qualify to be part of an international climate network? No, because the location is not standard. whatever the differences, these locations change readings in ways not related to changes not representative of the weather and climate.
The international climate network also has problems. Weather stations have been relocated and urban sprawl has surrounded many stations with structures that significantly influence readings. Many instruments originally installed in grassy rural areas have now been surrounded by cities. Many stations that were moved or replaced were improperly exposed.
To counter this problem, the United States installed a network of more than 100 weather stations at standardized sites. The network is expected to function for at least 50 years without being affected by urban or other non-standard influences.
Automatic weather observation stations provide weather data without human intervention. Below you see examples of meteographs from our station. Weather elements are plotted on the y-axis with time on the x-axis. The charts below cover 48 hours or 7 days from a specified date since the station was installed in November of 2019. Each chart is from the same time period so the data may be compared by scrolling down the page. These charts inform people who understand how changes in weather elements are related to each other.
The Automated Weather Observing Station
Temperature, Pressure, Relative Humidity, Dew Point

Temperature, Pressure, and Relative Humidity Sensors are housed in this Shelter
The temperature, relative humidity, and barometric pressure sensors are co-located in the shelter shown above. The shelter shields the sensors from direct sunlight and precipitation. The shelter looks like stacked upside down plates. Above the stack is a housing which contains a fan which ventilates the sensors. It draws air through the shelter and past the sensors before exhausting it out of a tube. Air temperature measurement without ventilation may lead to readings that are warmer than the environment. This is especially true on sunny days when the wind is light.. The shelter also shields the sensors from precipitation which may cause temperature readings to be cooler and relative humidity to read higher than the environment. The fan is not needed at night. The entire enclosure is white to reflect sunlight away from the shelter.

Temperature measurements in urban areas do not represent weather in surrounding rural areas
Here is a key point. For scientific purposes, measurements must be standardized. That means the type and quality of instrumentation and the exposure must meet specific criteria.
To measure the free air, instrumentation must be located over a natural surface and away from buildings, roads, and other man-made structures that change the measurements. Urban areas are notoriously poor locations to measure the free air because the variety of structures and different uses of land create many unnatural exposures. If the purpose is to measure conditions in the free air urban measurements do not reach the standards required.
On the other hand, if the purpose is to measure the differences in urban influences on temperature then urban exposures are necessary. The data is good for that purpose but not, for example, determining changes in climate.
Temperature accuracy: +/- .36 F, precision .1 F.
Pressure +/- 1.5 mb (.04” Hg).
Relative humidity: +/- 1.8%, 20% - 80%/ Range: 0% to 100%.

Changes in air pressure herald changes in the weather. That’s because pressure changes are associated with moving weather systems. There are also small diurnal (intraday) pressure changes that occur between day and night. However, these changes are often masked by larger changes associated with the weather systems. Pressure normally decreases slightly during the day and increases slightly at night. The changes on the chart below are are large enough to mask the diurnal changes. Diurnal changes for given locations are available.


Wind Vane and 3-Cup Anemometer
Wind Direction and Wind Speed
Wind direction and speed is measured by a roof mounted wind vane and three-cup anemometer. The three-cup design insures there is always a cup catching the wind, regardless of the wind direction.
The sensor assembly includes an on-board computer which calculates basic wind data output such as speed, direction, average wind for 2-minute and 10-minute intervals, and gusts.
Wind speed and direction are affected by nearby homes, trees, and terrain. Our rule of thumb for our location is wind speed is decreased by about 50% from what would be measured in open country. This is only a guess at this point based on comparing observations taken by this station and the one at the airport. Some day we can compare the data more scientifically.
Accuracy:
Wind speed: +/- 3% or +/- 0.3 m/s (+/- .67 mph), whichever is greatest. Starting threshold is less than 2.2 mph.
Wind direction: +/- 1 degree.
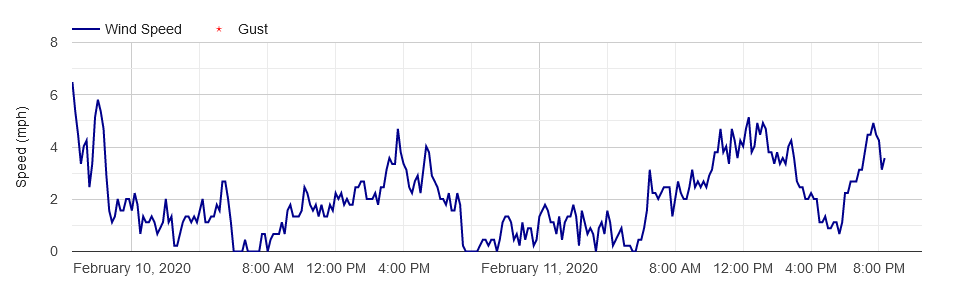
While it’s not always true, the surface wind speed in the Midwest often decreases at night and increases from morning through mid-afternoon. When the weather does not follow this pattern there is usually a weather system over-riding what usually happens. Different parts of the country may experience different trends.
Note: Winds at night may decrease while winds aloft may stay the same or change. Cooling of the surface at night is greater than aloft. This ‘separates’ (decouples) the air near the surface from the winds aloft. During the day sunshine heats the earth which may cause the air to mix (warm air rises and cool air aloft sinks) which brings stronger winds aloft down to the surface. Decoupling ends the mixing until the next day. You can see this affect on the wind speed chart below.

Siphon-type Tipping-Bucket Rain Gauge
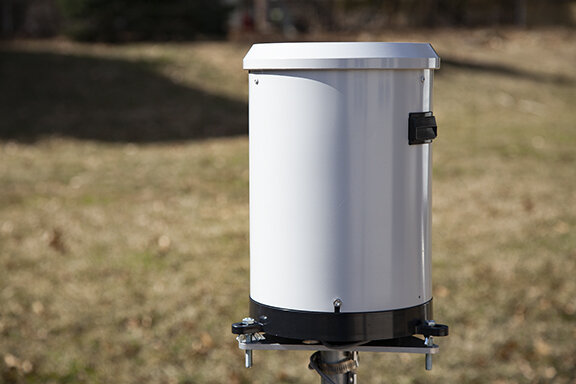
Exterior view of Tipping Bucket Rain Gauge - Siphon Type. The gauge does not measure snow.

Inside the Tipping Bucket Rain Gauge Showing Buckets and Leveling Bubble. The buckets rock back and forth like a teeter-totter as water fills each bucket. Each tip is one-one hundredth of an inch.

Funnel Opening of gauge with filter and entrance to the siphon. The Gauge meets WMO standards with a 200 mm opening (7.87”). This gauge is made in Australia.

Inside the Rain Gauge - looking up from the bottom. The siphon is located in the center. A screen vent is located on the side wall of the gauge.
The tipping bucket gauge meets WMO accuracy requirements. It is manufactured by Hyquest Solutions in Sydney, Australia and was supplied by Dyacon, the manufacturer of the automatic weather station.
The siphon increases the accuracy, essentially equal the USA National Weather Service Standard 8” Gauge. Typical tipping bucket designs are not as accurate when rainfall rates exceed 1 to 2 inches per hour. Although rare at any one location, our area does experience rainfall rates more than 6 inches per hour. We decided to use this gauge and it has not disappointed.
Tipping buckets are the most common type of gauge used for consumer and other applications. Tipping buckets use a “teeter-totter” design with a “bucket” on each side. The gauge collects rainfall through a funnel which directs the water into the buckets. When .01” is collected the teeter-totter tips, empties the bucket and closes a switch. The other bucket is raised to collect the next .01”. The gauge provides an estimate of the beginning and end times of the rain, the total rainfall, and the rainfall rate.
Why do some tipping buckets have lower accuracy? During heavy rain an extra drop may run into a bucket that is emptying. It should be counted with the next bucket tip. The siphon slows the flow of water just enough so each tip only has .01” in it, and not a drop more.
Hyquest Solutions siphon rain gauge accuracy:
Rainfall rates up to 10” per hour: +/- 2%.
Rainfall rates 10”+ to 20” per hour: +/-3%.
The gauge does not measure snow or the water content of snow.
The gauge opening is 7.87 inches (200 mm) which meets WMO specifications.
After making comparisons between the non-recording standard 4 inch gauge, the siphon tipping bucket, and conventional tipping bucket gauges it is apparent the siphon design is superior to the conventional tipping buckets during heavy rain-rate events. The siphon reads essentially the same as the standard 4 inch gauge which is certified by the National Weather Service as having the same accuracy as the standard NWS 8” gauge.
The advantage of the siphon tipping-bucket gauge is convenience: its data is accessed without going outside to read the gauge and it self-empties. It also updates to our website automatically and includes a graph of the rainfall and it creates a spreadsheet of the rainfall.
Our experience shows the gauges agree within .01” during steady rains with light winds when the rainfall rate does not change substantially. During heavy shower-type rains with large variations in the rainfall rate and gusty winds, the gauges usually also agree but we sometimes see differences up to about .10” after rainfall of several inches. Our 8” gauge usually measures more rain than the CocoRaHS gauge (scroll up to read the CoCoRaHS gauge description). The difference may be caused by the wind effects around the 4” CoCoRaHS gauge vs the 8” tipping bucket gauge caused by the exposure near homes and trees in our urban setting.
The most accurate gauges are weighing gauges. They work as the name implies - they catch the rain and weigh it. Inaccuracies would come from wind effects where the gauges are exposed.
Rain is recorded on the following graph. The stair-steps on the blue line indicate when rain has been measured. The last stair-step on the right indicates the total rain since midnight. If no rain is observed between observations the blue line will be horizontal. It is zeroed at midnight.
The purple line indicates the rainfall intensity. It displays is the rainfall rate in inches per hour. When using the weather station meteographs (not what you see on this page because this is only a screen-grab) hover the cursor over the graph to see individual observations. A data display window shows the observation time, the rainfall since the last observation, and the rainfall rate.
NOTE: The chart below is only an example. It will not display rainfall or rainfall rate in an active window.

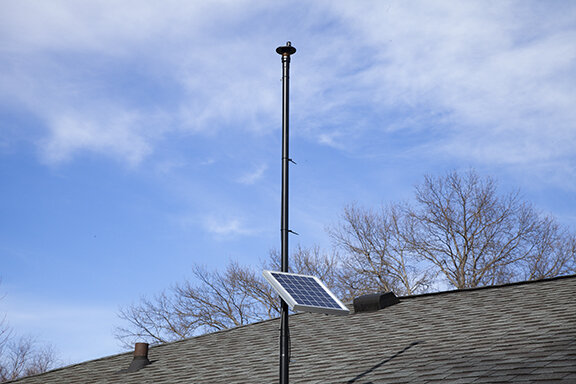
Solar Sensor on top and Solar Panel on Bottom of Pole
Solar Sensor and Solar Panel
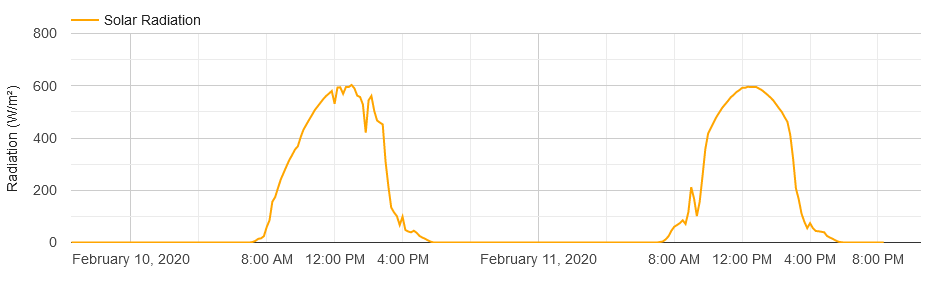
The solar sensor and solar panel are located on a pole. The sensor, at the top of the pole, records incoming solar radiation in watts per square meter. The solar panel generates electricity.
Sunlight is an intermittent power source. Solar insolation changes with the seasons, time of day, cloud cover and precipitation. A battery is used to smooth out the variations. To guarantee power during extended cloudy periods we are adding a connection to our local electric utility. Currently the station will operate for 4 days without needing to charge the battery.
Solar energy is measured in watts per square meter.
Accuracy: +/- 5%
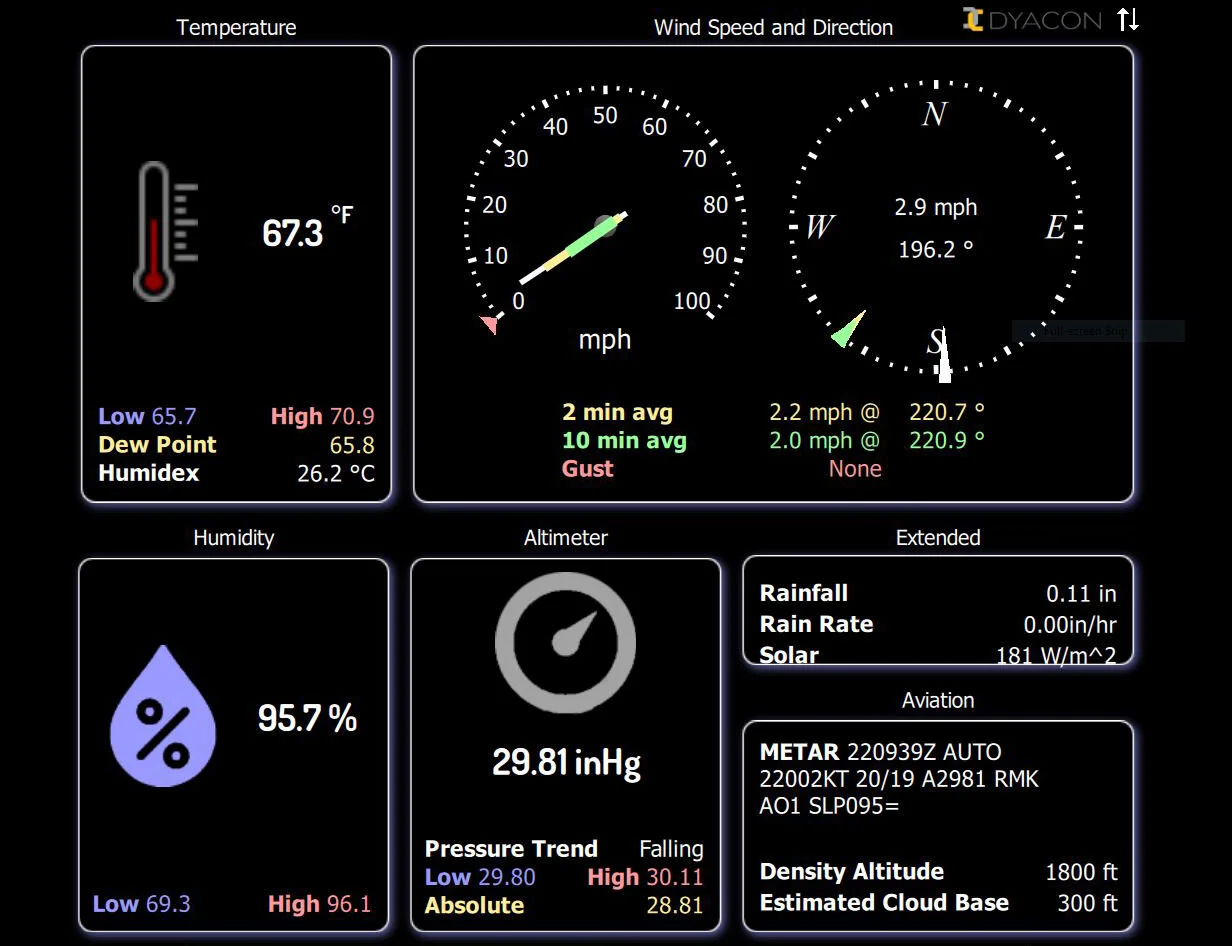
Screen grab of the live weather station display. The live display is not available online.
Image from August 22, 2020 at 10:50 a.m.