Clouds of the Day - April 16, 2020

Cirrostratus

Cirrostratus

Altocumulus and Altostratus

Altocumulus and Altostratus

Altocumulus

Altocumulus

Cirrostratus (Upper Right) and Altostratus (Lower Left)

Cirrostratus (Upper Right) and Altostratus (Lower Left)

Altocumulus and Altostratus

Altocumulus and Altostratus

Cirrostratus

Cirrostratus

Never Look Directly at the Sun!

Looking directly at the Sun will cause permanent damage or blindness. This includes looking with the naked eye or viewing directly through telescopes, binoculars, or other devices without proper protection! Do not do it! To learn about safe ways to view the Sun read information from the links below. Follow directions exactly!

Mayo Clinic on Solar Eye Damage
How to Watch a Solar Eclipse - Mayo Clinic
How to Safely View the Sun (NASA)
Make a Pin Hole Projector
Safe Viewing from Space Weather
Safe Viewing from EarthSky

Halo (Never look directly at the Sun!)

Halo (Never look directly at the Sun!)

Halo (Never Look directly at the Sun!)

Halo (Never Look directly at the Sun!)

Halo (Never look directly at the Sun!)

Halo (Never look directly at the Sun!)

The solar radiation profile for the 16th is shown below. Under clear skies the profile would be a smooth line that reaches a peak around 13:30 (1:30 p.m.) The jagged pattern is caused by clouds, some thin and others thicker), covering and uncovering the Sun.

Solar_Radiation_4-17-20.PNG

Clouds of the Day - April 15, 2020

Under the Spell of Cumulus

Today dawned clear but it didn’t stay that way. The solar radiation profile from today is on the far right of the meteograph below. Notice how radiation increased without interruption through the morning. Around Noon the first dip occurred in the profile before a brief sharp rise again. This coincided with a brief blockage due to clouds. Then came the sudden drop as cumulus clouds formed and spread across the sky. From then on it is easy to see the variations in cloud cover as solar energy increased and decreased quickly through out the afternoon. Look at the pictures below to see how the sky looked during the early afternoon.

SolarEnergy_4-15-20.PNG
Cumulus Clouds from Below

Cumulus Clouds from Below

Cumulus Dark Cloud Base

Cumulus Dark Cloud Base

Wind blown cumulus

Wind blown cumulus

Cumulus forming in cold air - Temperature 36

Cumulus forming in cold air - Temperature 36

One more view of a ragged sky full of cumulus formed by solar heating of a cold air mass

One more view of a ragged sky full of cumulus formed by solar heating of a cold air mass

Clouds of the Day - April 14, 2020

A seasonably cold polar air mass with gusty northerly winds dominates the weather today. Wet soil, wind, and sunshine this morning has enhanced evaporation. April sunshine is much more effective than the winter sun. It did not take long for warming surface temperatures to support updrafts and clouds. Cumulus was the predominate cloud type today and snow showers developed by late morning and early afternoon. There was no accumulation of snow. The photo below show a variety of cumulus ranging from small to medium size.

Cumulus

Cumulus

Cumulus

Cumulus

Cumulus

Cumulus

Cumulus

Cumulus

Cumulus

Cumulus

Cumulus

Cumulus

Cumulus

Cumulus

Cumulus

Cumulus

Cumulus

Cumulus

Cumulus

Cumulus

Cumulus

Cumulus

Clouds of the Day - April 13, 2020

Today dawned clear but it did not end that way. Strong wind and sunshine lead to the formation of cumulus clouds and snow showers.

On a clear day you can see forever. Polar air mass covering the midwest.

On a clear day you can see forever. Polar air mass covering the midwest.

Small Cumulus (cumulus humilus) with small fractus clouds

Small Cumulus (cumulus humilus) with small fractus clouds

Dissipating Cumulus leaves fractus behind. Dry air mixes into the cloud.

Dissipating Cumulus leaves fractus behind. Dry air mixes into the cloud.

Small cumulus clouds

Small cumulus clouds

cumulus (cumulus mediocris)

cumulus (cumulus mediocris)

cumulus (cumulus mediocris)

cumulus (cumulus mediocris)

cumulus (cumulus mediocris)

cumulus (cumulus mediocris)

Cumulus (cumulus mediocris)

Cumulus (cumulus mediocris)

Cumulus (cumulus mediocris)

Cumulus (cumulus mediocris)

SNow showers developed by mid-afternoon. Notice the faint streaks near the center of the photo

SNow showers developed by mid-afternoon. Notice the faint streaks near the center of the photo

The streaks of snow are much more prominant.

The streaks of snow are much more prominant.

The air temperature was in the mid-30s. The source region for the air mass was in northern canada where temperatures were still -10 F.to - 20 F.

The air temperature was in the mid-30s. The source region for the air mass was in northern canada where temperatures were still -10 F.to - 20 F.

Clouds of the Day - April 11, 2020

This post is in progress throughout today as a storm system spreads lowering clouds and rain across the area into Easter Sunday.

10:23 a.m. - Cirrus and Cirrostratus

10:23 a.m. - Cirrus and Cirrostratus

10:24 A.m. - Cirrus, Altocumulus, Altostratus

10:24 A.m. - Cirrus, Altocumulus, Altostratus

10:25 A.M. - Cirrus, Altocumulus, Altostratus

10:25 A.M. - Cirrus, Altocumulus, Altostratus

12:18 p.m. - Cirrostratus with darker and lower Altostratus bottom

12:18 p.m. - Cirrostratus with darker and lower Altostratus bottom

12:19 p.m. - Close-up of Altostratus, bottom half of photo

12:19 p.m. - Close-up of Altostratus, bottom half of photo

12:20 p.m. - Cirrostratus top, altocumulus wave clouds bottom

12:20 p.m. - Cirrostratus top, altocumulus wave clouds bottom

Photos above taken from Cedar Falls, Iowa, which is located just northwest of Waterloo. All photos, except last one of wave clouds, are looking south toward rain shown here on Des Moines NWS Radar. The Darker altostratus clouds in photos are north o…

Photos above taken from Cedar Falls, Iowa, which is located just northwest of Waterloo. All photos, except last one of wave clouds, are looking south toward rain shown here on Des Moines NWS Radar. The Darker altostratus clouds in photos are north of this area of rain. Rain cells are moving northeast but the entire area of clouds and rain is shifting to the north.. This image is courtesy of Radarscope software. Radar image from screen grab at 12:35 p.m. CDT.

1:18 p.m. - Altocumulus - looking southeast, ceiling 7000 ft

1:18 p.m. - Altocumulus - looking southeast, ceiling 7000 ft

1:19 p.m. - Altocumulus - looking southeast, ceiling 7000

1:19 p.m. - Altocumulus - looking southeast, ceiling 7000

1:20 p.m. - altocumulus - Looking souteast, photo zoomed in, ceiling 7000

1:20 p.m. - altocumulus - Looking souteast, photo zoomed in, ceiling 7000

2:32 P.M. - Nimbostratus; light rain began at 2:27 p.m.

2:32 P.M. - Nimbostratus; light rain began at 2:27 p.m.

2:33 p.m. - Nimbostratus; light rain

2:33 p.m. - Nimbostratus; light rain

2:34 P.M. - Nimbostratus; Light Rain; note the fragmented cloud in foreground forms by condensation of evaporating light rain

2:34 P.M. - Nimbostratus; Light Rain; note the fragmented cloud in foreground forms by condensation of evaporating light rain

5:34 P.M. - Cumulus, Stratocumulus, Altostratus after .02 inches of rain

5:34 P.M. - Cumulus, Stratocumulus, Altostratus after .02 inches of rain

5:35 p.m. - Cumulus, Stratocumulus, Altostratus after light rain

5:35 p.m. - Cumulus, Stratocumulus, Altostratus after light rain

An Unsteady Day - April 9, 2020

Today was a busy weather day. No, there weren’t major storms here. It was just a blustery day, typical for this time of year. But it turns out that it was an interesting study in how our weather works. In this case the weather was very busy behind the scenes.

The Story

Strong winds from an invading polar high pressure, gusty winds, updrafts, downdrafts, and snow showers made for a fun-filled day - if you like that sort of adventure. Between Noon and 8:00 p.m. today increasing air pressure pushed the general wind speeds to about 20 mph. However, air descending to the surface from higher altitudes brought 50 mph gusts to ground level. Solar heating causes the atmosphere to mix with updrafts and downdrafts. These motions created the gusty winds, bringing higher altitude wind speeds to the surface.

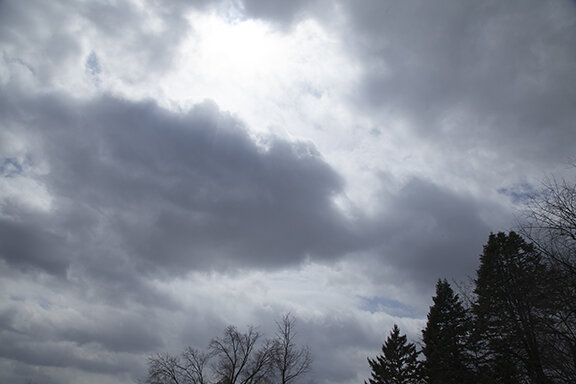
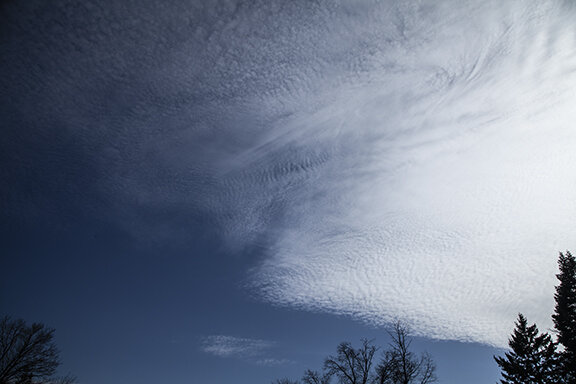
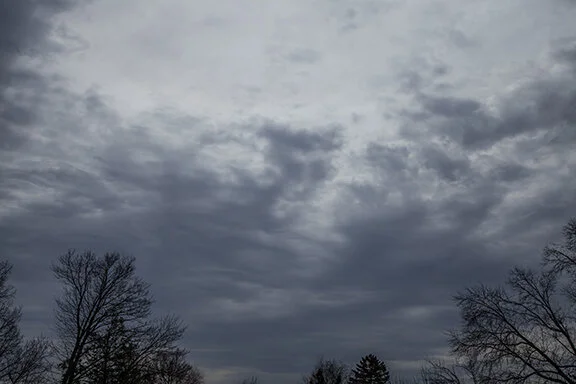
When the solar heating waned in the late afternoon all the fun came to a halt. The gusts stopped and general wind speeds decreased. The heating and a storm system aloft had supported the development robust cumulus clouds with snow showers. They dissipated as the sunshine decreased.

The Meteographs

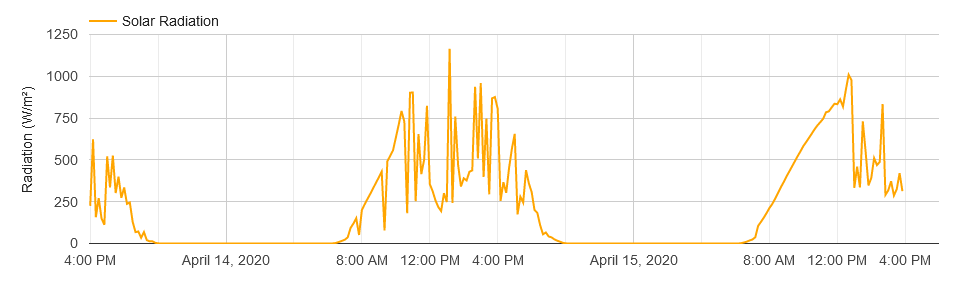
The following meteographs and the photos in the previous post paint an interesting picture. The graphs for temperature, dew point, relative humidity, barometric pressure, wind direction, wind speed, and solar radiation from our weather station tell the story. While the graphs cover the previous 48-hours, the time period of interest is from Noon to 8:00 p.m on the 9th. The tracings show a period of very unsteady changeable weather. It is a great example of how an automatic weather observing station picks up subtle and not so subtle weather changes.

The temperature (red line), dew point (green dotted line), relative humidity (blue dashed line), and air pressure were all unsteady.  At the same time, the wind speed increased and became very gusty with snow showers. The solar radiation was very unsteady. 

Passing showers with gusty winds caused small changes in air pressure that show up as small bumps in what is a steady pressure increase during the day. Approaching high pressure was responsible for the general all day rise in pressure. Temperature and dew point were very unsteady as the up and down motion of gusty winds were mixing air with different temperature and dew points. The relativity humidity was unsteady because it is directly related to changes in temperature and dew point - which were unsteady. Wind speed and wind gusts increased as stronger winds mixed down to the surface. The solar radiation was changing wildly as clouds covered and uncovered the Sun.

The solar radiation graph is revealing. The overall increase in solar heating is shown very well in the general shape of the graph. Within the general shape there are many large short-term swings in intensity caused by clouds blocking and unblocking the Sun. It was the changes in solar radiation which was behind the changes in the weather. It changed the heating, which changed the air mixing, which changed the wind gusts and development of cumulus clouds and snow showers. As the graphs show, all of the readings smoothed out as the Sun set.

Annotation 2020-04-09 224914.png
Annotation 2020-04-09 230123.png

Clouds of the Day - April 9, 2020

A blustery day with snow showers and a sky full of cumulus.

Cumulus

Cumulus

Cumulus

Cumulus

Cumulus

Cumulus

Cumulus

Cumulus

Cumulus

Cumulus

Cumulus

Cumulus

Clouds looked wind blown as colder air and winds more than 40 mph swept the area.

Clouds looked wind blown as colder air and winds more than 40 mph swept the area.

Late afternoon snow shower

Late afternoon snow shower

Snow streaks falling from large cumulus

Snow streaks falling from large cumulus

One more view of snow showers

One more view of snow showers

Graupel on The Deck - The snow showers contained graupel - also called soft hail or snow pellets. Graupel forms when super-cooled water droplets freeze on falling snow flakes. Surface temperatures were near 40 F during the snow showers. Temperatures…

Graupel on The Deck - The snow showers contained graupel - also called soft hail or snow pellets. Graupel forms when super-cooled water droplets freeze on falling snow flakes. Surface temperatures were near 40 F during the snow showers. Temperatures aloft were below freezing.

Clouds of the Day - April 7, 2020

Stratocumulus - A Story to Tell

This morning dawned with fog but after a couple of hours visibility improved leaving these clouds behind. The clouds are all that remained after the fog dissipated.

As temperature increases, the relative humidity decreases - the fog evaporates. We see the fog thinning until all that remains are the clouds you see in the photos. Fog is a stratus (flat/layered) cloud at ground level. Cumulus puffy or lumpy clouds caused by rising air currents. The clouds in the photos have both flat and lumpy shapes; hence the name stratocumulus.

For the scientific explanation of what happened scroll down below the photos. View the pictures below and then scroll down to see the temperature, relative humidity, and dew point traces from our weather station this morning. The traces illustrate what happened. When reading the explanation keep in mind that dew point is a measure of the amount of moisture in the air. If it increases (decreases) then moisture is increasing (decreasing) in the air. Relative humidity is the relative amount of moisture in the air compared to the capacity of the air to retain moisture. As temperature or dew point rise the air gets closer to saturation - the point at which the relative humidity becomes 100%. Clouds form when relative humidity approaches 100%.

Stratocumulus from dissipating fog

Stratocumulus from dissipating fog

Stratocumulus from dissipating fog

Stratocumulus from dissipating fog

Stratocumulus from dissipating fog

Stratocumulus from dissipating fog

Stratocumulus from dissipating fog

Stratocumulus from dissipating fog

Looking South at 12:15 p.m. after mixing evaporated most of the clouds.

Looking South at 12:15 p.m. after mixing evaporated most of the clouds.

Looking North at a cumulus cloud formed by rising warm air currents.

Looking North at a cumulus cloud formed by rising warm air currents.

End of the Day - Cumulonimbus (thunderstorm) southeast

End of the Day - Cumulonimbus (thunderstorm) southeast

Cumulonimbus (thunderstorm) - Hiding behind the trees - Evening

Cumulonimbus (thunderstorm) - Hiding behind the trees - Evening

What happened last night and this morning demonstrates how temperature, dew point, and relative humidity are related. Temperature is a measure of heat energy in the air. Dew point is a measure of the moisture in the air. Relative humidity is a measure of how much moisture is in the air compared to its capacity of contain moisture.

For example, if moisture remains steady and temperature increases (decreases), the relativity humidity decreases (increases). If dew point increases (decreases) the relative humidity increases (decreases). If temperature increases (decreases) and dew point increases (decreases) combinations of relative humidity are endless. Relative humidity depends on the values of both temperature and dew point which may exist together in any combination. Relative humidity depends on both temperature and relative humidity but temperature and dew point do not depend on each other.

TPH_trace_4-7-2020.PNG

Follow the traces on the chart. Temperature is red. Dew point is the green dotted line. Relative humidity is the blue dashed line. Temperature and dew point were almost identical all night which meant the relative humidity was near 100%. The air was nearly saturated and fog (a cloud near the ground) formed. After sunrise the temperature increased and relative humidity decreased. Notice how the temperature and dew point lines diverged. As the difference between temperature and relative humidity increases relative humidity decreases. As relative humidity decreased the fog began to thin - it evaporated.

What ultimately happened was sunlight began to heat the earth increasing the temperature. That caused the air to rise which began to mix the air. Warmer air near the ground began to rise and drier air aloft descended. This mixing warmed and dried the air enough to cause evaporation of the fog. The layer of moist air near the ground was very shallow. In the end the moist air became mixed and the relative humidity in the lower levels of the atmosphere dried enough for the fog and most clouds to dissipate.

The entire process takes place in front of our eyes. The bottom left photo, taken at 12:15 p.m. shows only a few remnants left over from the mixing process that evaporated the fog and finally the left over stratocumulus. The rising air currents and sinking air currents stirred the air, mixing in drier air. The rising motion is not being sustained because the air is stable after mixing so the sky is clear. On the other hand, looking north at the bottom right photo, there is a band of cumulus clouds partly explained by a storm system to the north that is sustaining rising motion in a slightly unstable air mass. This is maintaining upward motion and cumulus clouds. Clouds do have a story to tell.

Where is Venus?

NASA Photo - Mariner

NASA Photo - Mariner

Venus, Earth’s nearest planetary neighbor is putting on quite a show in the western evening sky. f you would like to follow the latest on Venus here are three links that may interest yoo. Venus is visible beginning before sunset high in the western sky and then for the remainder of the eveing. It will be brightest on April 27th. Don’t miss the chance to see it in the evening sky before and after sunset. Through April and into May.

Links:

https://theskylive.com/venus-tracker

http://www.skymarvels.com/infopages/vids/Venus%20-%20Current%20001.htm

https://solarsystem.nasa.gov/planets/overview/

Clouds of the Day - April 4, 2020

Stratocumulus - looking south-southwest

Stratocumulus - looking south-southwest

Stratus with stratocumulus lower right - looking north

Stratus with stratocumulus lower right - looking north

Stratocumulus with higher cirrocumulus behind

Stratocumulus with higher cirrocumulus behind

ANother view of stratocumulus with higher cirrocumulus behind

ANother view of stratocumulus with higher cirrocumulus behind

Stratus (R), Stratocumulus (L), Cirrus & Cirrocumulus behind

Cirrostratus - looking south-southeast

Cirrostratus - looking south-southeast

Altocumulus - looking south

Altocumulus - looking south

Altocumulus

Altocumulus

Altocumulus with Sun visible

Altocumulus with Sun visible

Altocumulus, (Top R) Cirrostratus (R)) and cirrocumulus (Center).

Altocumulus, (Top R) Cirrostratus (R)) and cirrocumulus (Center).

Altocumulus - unusual wave pattern Right

Altocumulus - unusual wave pattern Right

Closeup of unusual Altocumulus wave Pattern

Closeup of unusual Altocumulus wave Pattern

Clouds of the Day - April 3, 2020

Stratus - looking southwest

Stratus - looking southwest

Nimbostratus about 30 minutes later - looking southwast

Nimbostratus about 30 minutes later - looking southwast

The difference between stratus and nimbostratus is the presence of rain. Since rain was not falling at our location the cloud is classified as stratus. Rain was likely falling in the distance - based on how the cloud looked. However it is classified as stratus until precipitation (rain or snow) is observed. Other than possibly drizzle, true stratus do not produced precipitation. The presence of rain indicates a much thicker cloud and confirms the cloud is nimbostratus. Nimbostratus often form in the mid-levels and lowers as the rain saturates lower layers. Nimbostratus can easily be more than 10,000 feet thick.

Clouds of the Day - March 31, 2020

Today’s Clouds - High Clouds

Cirrus that look like fibers or hair

Cirrus that look like fibers or hair

Cirrostratus (top half)) cirrus like fibers (lower left)

Cirrostratus (top half)) cirrus like fibers (lower left)

Cirrus in fibers and strands, Cirrocumulus (top center)

Cirrus in fibers and strands, Cirrocumulus (top center)

Cirrostratus (upper right) and cirrus fibers in bands, streaks, and streamers

Cirrostratus (upper right) and cirrus fibers in bands, streaks, and streamers

Cirrostratus (top) and cirrus streamers below

Cirrostratus (top) and cirrus streamers below

Primarily Cirrostratus but with patches of opaque cirrus left

Primarily Cirrostratus but with patches of opaque cirrus left

These photos of cirrus clouds were taken within a 30 minute time period this afternoon - all from our backyard. Clouds of ice and the winds aloft create unusual patterns ranging from filaments to streaks to streamers and smooth locks of hair. Step outside and look up to see a free show put on by Mother Nature.