Following a Storm

This post began on March 27th and is being added to here in order to keep all related posts with the original.

March 29, 2020, 12:15 p.m. CDT

Gravity waves are common in the atmosphere. The waves form when moving air disturbs stable layers in our atmosphere. Once disturbed these layers will oscillate up and down. The up and down motions continues until the energy dissipates. Think of waves on a lake or ocean. They can move long distances. The same happens in the atmosphere.

For example thunderstorms push air aside as rising air expands up and outward. This disturbs any stable layers that are in the way and causes waves to move away from the storms. We all have made waves while swimming. Boats make waves while moving through the water. The waves are similar to gravity waves in the atmosphere. Speed boats bounce over waves. Airplanes encounter turbulence caused by waves. If clouds are in the way, the waves become visible. Waves that come from different directions create complex patterns in the clouds.

Below are two photos showing waves that formed when thunderstorms moved through central Iowa on Saturday, March 28th. The waves created by the storms and waves caused by winds aloft created the formations you see in the photos.

clouds associated with gravity waves, Photo by Craig Johnson

clouds associated with gravity waves, Photo by Craig Johnson

Close-up of clouds created by gravity waves, Photo by Craig Johnson

Close-up of clouds created by gravity waves, Photo by Craig Johnson


March 29, 11:00 a.m. - Sequence of Surface Maps

A sequence of 5 maps beginning yesterday (Saturday, March 28th at 7:00 a.m. CDT) was added to this post today. The sequence shows the progression of a surface low that developed over the Southern Plains and moved north to northern Lake Michigan by 11:00 a.m. CDT this morning (Sunday, March 29th). by using the station model plots on the maps watch how the weather changed for any location plotted on the map. Pick out a station and notice the following as you move from map to map:

  1. How did the cloud cover change?

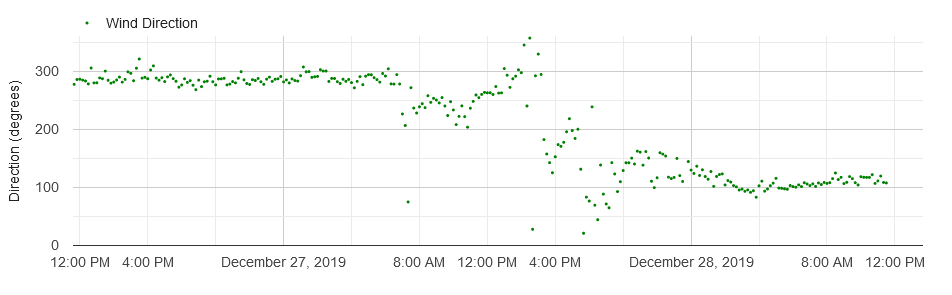
  2. How did the wind direction and speed change?

  3. How did the temperature and dew point change?

  4. How did the cloud ceilings change?

  5. How did the weather change? Was there fog, rain, or thunder, at any stations?

  6. How did the pressure change?

  7. What was the path of the low center?

  8. What is the visibility?

  9. Notice that winds are strongest where the isobars are closest together.

This map includes station model plots, isobars (lines showing of constant pressure), and the low center. The plotting was limited to simplify the maps.

Station model plots pack a lot of data into a small space. There were reports of at least 5 tornadoes touching down from southwest to northeast Iowa during the afternoon and early evening. The tornadoes formed near the low center where a boundary between warmer and cooler air created changes in wind direction with height. Temperatures across the boundary ranged from 40s on the north side to 60s on the south. Wind shear and upward motion was sufficient to spin up tornadoes. The boundary is visible extending east from the low center noting the difference in temperature, dew point, and wind change across the boundary. It’s the difference in readings that matters.

Severe weather reports are available here.

Surface Map, 11:00 a.m., Sunday, March 29, 2020; Map plotted by Digital Atmosphere, www.weathergraphics.com

Surface Map, 11:00 a.m., Sunday, March 29, 2020; Map plotted by Digital Atmosphere, www.weathergraphics.com

Surface Map, 7:00 p.m., Saturday, March 28, 2020; Map Plotted by Digital Atmosphere, WWW.weathergraphics.com

Surface Map, 7:00 p.m., Saturday, March 28, 2020; Map Plotted by Digital Atmosphere, WWW.weathergraphics.com

Surface Map, 4:00 p.m., Saturday, March 28, 2020; Map Plotted by Digital Atmosphere, WWW.Weathergraphics.com

Surface Map, 4:00 p.m., Saturday, March 28, 2020; Map Plotted by Digital Atmosphere, WWW.Weathergraphics.com

Surface Map, 1:00 p.m. CDT, Saturday, March 28, 2020; Map Plotted by Digital Atmosphere, www.weathergraphics.com

Surface Map, 1:00 p.m. CDT, Saturday, March 28, 2020; Map Plotted by Digital Atmosphere, www.weathergraphics.com

Surface Map, 10:00 a.m., Saturday, March 28, 2020; Map Plotted by Digital Atmosphere, WWW.Weathergraphics.com

Surface Map, 10:00 a.m., Saturday, March 28, 2020; Map Plotted by Digital Atmosphere, WWW.Weathergraphics.com


March 28, 2020, 11:00 a.m. CDT - Low Pressure Moves North

Be sure to scroll down to see the earlier posts. This post is an exercise in reading the station model plots. Learn more about stations model pots on our home page. Hints are included below.

The low pressure center has moved into central Kansas as of 7:00 a.m. CDT this morning. Using the station model plot format you can see the following:

  1. A warm front from Kansas to Ohio is dividing cool air to the north from warmer air to the south. Temperatures south of the front are in the 60s and 70s. To the north readings are in the 40s. Reminder: The temperature is the number plotted to the upper left of the station location. For example St. Louis, Missouri reports 69 degrees. Chicago is 46.

  2. Cold front with cooler temperatures and drier air extends from Kansas south into Oklahoma. Ahead of the front temperatures are in the 60s and 70s. Behind the front temperatures are in the 50s, 40s, and 30s. There 20s, teens, and single digit readings in Colorado. Dew points ahead of the front are in the 60s while behind the front dew points are in the 50s, 40s, 30s, and 20s. The dew point is plotted below the temperature.

  3. Looking at the weather symbols, fog is reported in Kansas, Nebrasksa, and Iowa. Rain is reported in Michigan, Illinois, Wisconsin, Iowa, South Dakota, and Nebraska. Look at the station location symbols (circles and squares) for cloud cover. Every station located north of the warm front reports overcast skies; their station location symbols are 100% filled in black. To find examples of stations reporting clear skies look at Wyoming and Colorado.

  4. Light snow is reported in western Nebraska and northeastern Colorado.

  5. Notice how the wind is circulating counterclockwise around the low center in Kansas. Colder air is already flowing in behind the storm from Wyoming and Colorado into western Kansas, Nebraska, and the Texas Panhandle. See the streamline map below. Air is flowing northward into Missouri and the Ohio Valley. Another cold front is dropping south into South Dakota, Minnesota, and northern Wisconsin. Note the temperatures in the 30s behind the front.

  6. The low is expected to move north into Nebraska today.

SFC_TOP_12Z_3-28-2020.PNG

March 27, 2020 - Large Storm Headed for the Upper Midwest

A strong storm is expected to develop over the Southern Plains and move northeastward across Iowa on Saturday and Saturday night. Clouds are increasing across the state this morning (Friday, March 27th). We will follow this storm using a variety of information including maps, satellite images, and radar.

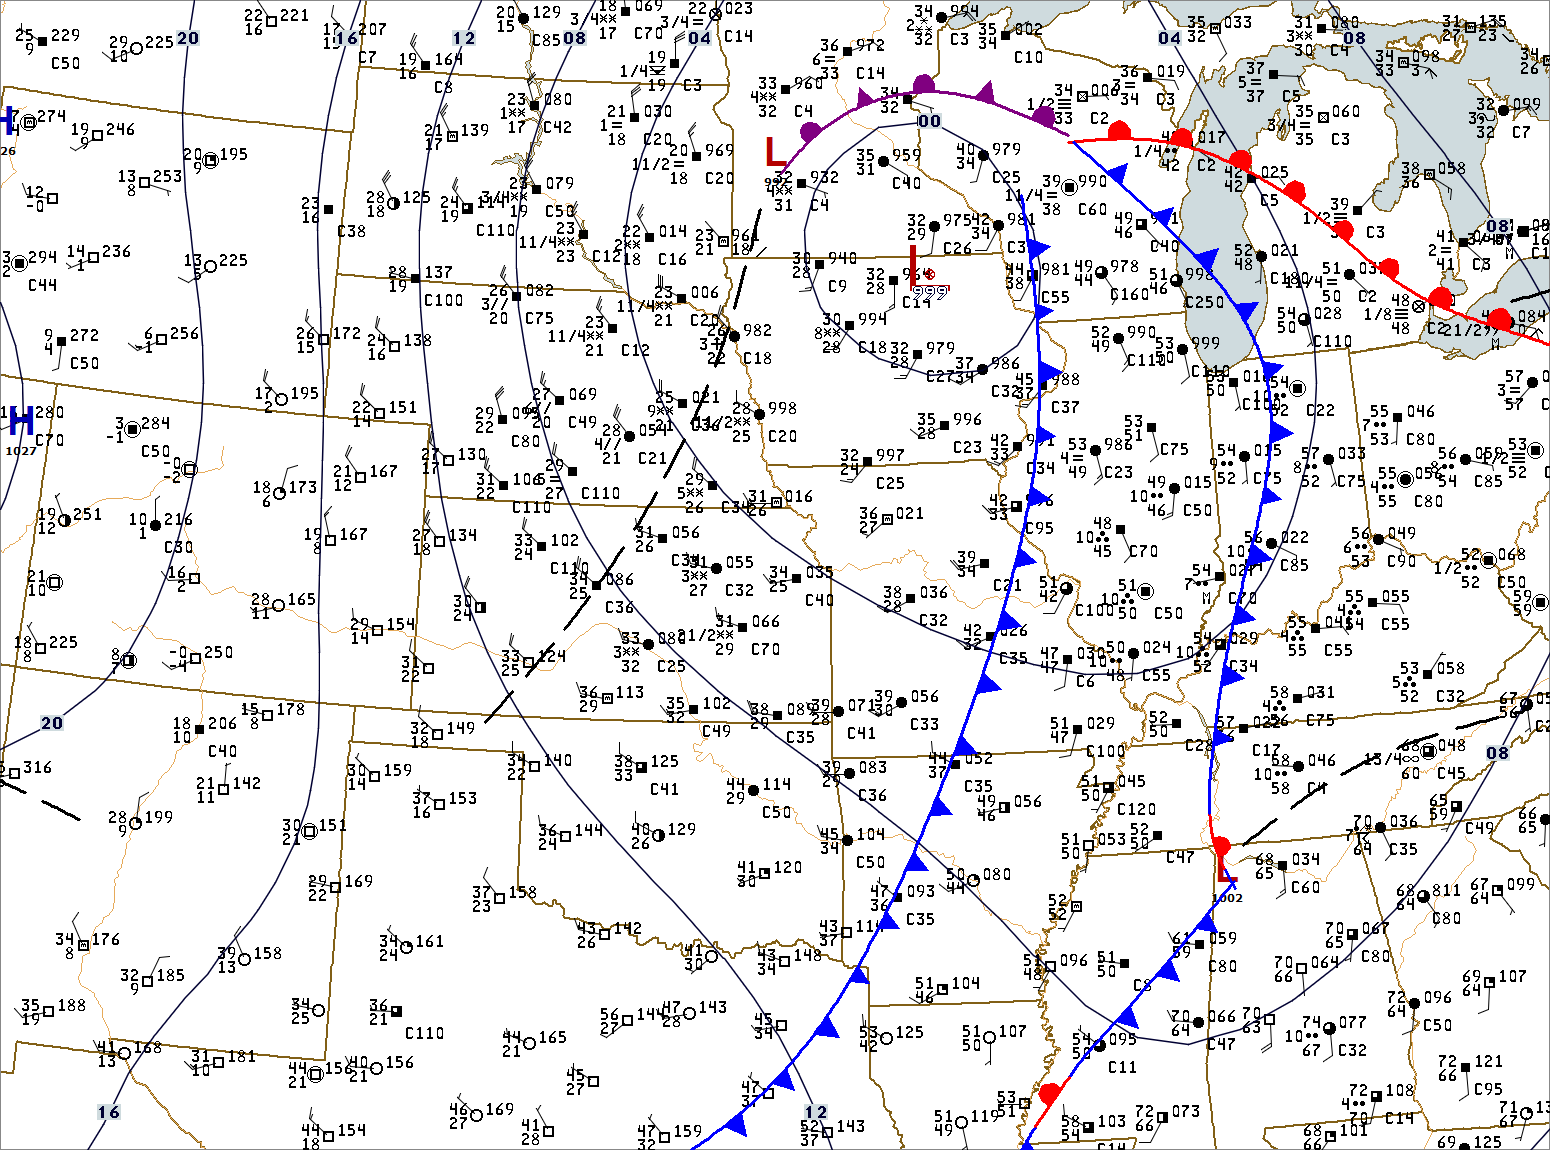
Our first map is a weather depiction chart. It uses part of the Station Model Plot format to display current weather. The chart displays sky cover, cloud ceiling, current weather, and visibility. It also includes the current position of fronts, low and high centers, and isobars.

Sky Cover is indicated by the amount of the station location circle or square that is filled with black.
Cloud ceiling is indicated with the letter “C” followed by 1, 2, or 3 digits. Add two digits to the number and you will know the cloud height in thousands of feet.
Current weather symbols are located just left of the station location circle or square.
Visibility is indicated to the left of the current weather symbol. It may be a whole number or a fraction.

The map below shows a low pressure system developing over northeastern New Mexico to the Texas Panhandle. Fog is widespread over Kansas, southeastern Nebraska, central South Dakota and western Iowa.

We will watch this storm develop and move northeastward.

WX_Depiction_TOP_15Z_3-27-2020.jpg

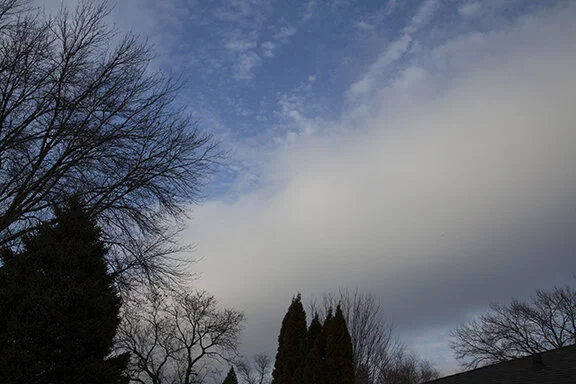
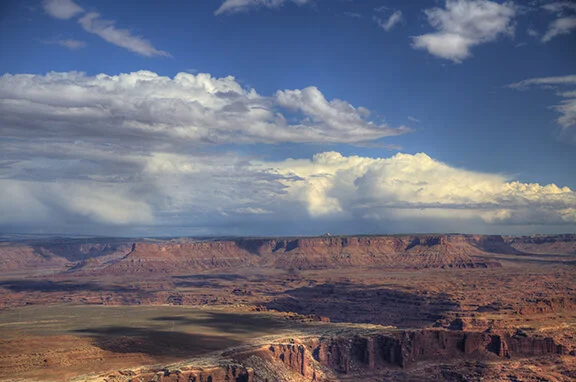
Clouds are increasing from the southwest at Cedar Falls, Iowa.

Looking South from Cedar FAlls, IA, 11:45 a.m. CDT, 3-27-2020

Looking South from Cedar FAlls, IA, 11:45 a.m. CDT, 3-27-2020

Looking SSW from Cedar Falls, IA, 11:45 a.m. CDT, 3-27-2020

Looking SSW from Cedar Falls, IA, 11:45 a.m. CDT, 3-27-2020

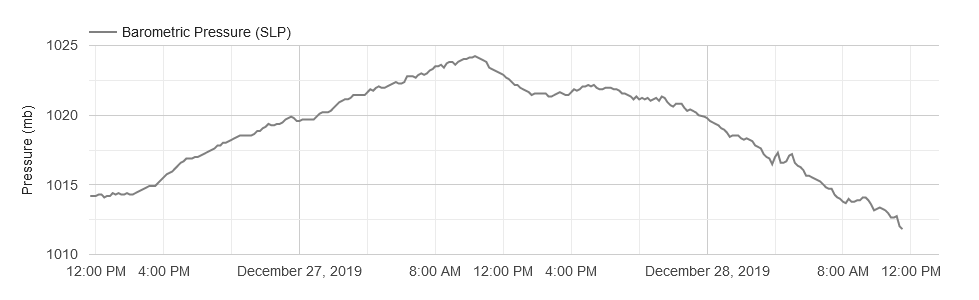
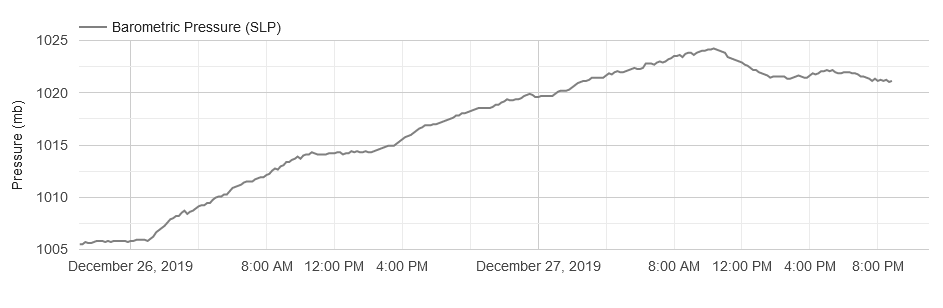
Pressure trace from Cedar Falls, Iowa. The pressure began falling at 11:00 p.m. on March 26th and has been unsteady since 2:20 a.m. March 27th. Watch the live weather station trace that can be accesses on our home page.

Pressure_3-27-2020_Dyacon.PNG

Cloud Roll

2020_03_24_3138_Sc_4x6_96dpi.jpg

Stratocumulus, Photo copyright by Craig Johnson 3-24-2020

This cloud above was one of three clouds shaped like long parallel tubes lined up in northwest to southeast oriented rows. In between the rows there were nearly cloud-free rows of blue sky. The cloud rows were caused by waves rippling through the air.

The pattern of waves is similar to waves that form on lakes and the ocean. The clouds form where the waves crest (upward motion) and disappear where air sinks (downward motion). The entire system was moving to the northeast.

Because the clouds have both cumulus (lumpy) and stratus (flat) characteristics it is called stratocumulus.

The photo below was taken looking to the northwest underneath one of the cloud rows. Sometimes the cloud rows may be much more distinct and have sharper edges.

Stratocumulus; Photo by Craig Johnson, Copyright 3-24-2020

Stratocumulus; Photo by Craig Johnson, Copyright 3-24-2020

Reading the Signs

Read the signs and you will learn about your weather.

For the weatherwise, storms send out signs. Today was one of those days. Cirrostratus (Cs) is often a storm’s calling card. This is especially true if cirrostratus is widespread and increasing across the sky. In the photo below Cs is covering more of the sky than it appears. Even the blue sky in this photo is covered by cirrostratus. Cs is usually thin, sometimes almost invisible. Except for the “thicker” Cs on the left and bottom of this photo, the Cs might be entirely missed, especially at night. Look closely when you look at the sky. You may see very thin filaments of Cs.

The thing is, in this photo the Cs is extensive and it is thickening to the west (left) and north. The sky should be reported as overcast with thin Cs. Patchy Cs usually does not herald a storm. But if Cs is increasing in thickness and steadily overspreading the sky it is worth watching. If a storm is coming the Cs will likely thicken and overspread the sky before lower clouds appear.

Cirrostratus 3-17-2020, Photo by Craig Johnson

Cirrostratus 3-17-2020, Photo by Craig Johnson

The Cs in the next photo is more prominent. It is spreading over the sky from right to left. The increasing coverage and thickness indicates there may be a storm approaching.

Ciirrostratus increasing from right to left. Photo by Craig Johnson 3-17-2020.

Ciirrostratus increasing from right to left. Photo by Craig Johnson 3-17-2020.

About 6 hours after the Cs first appeared, the clouds thickened and lowered. The photo below shows a middle cloud layer that appeared underneath the Cs. This cloud deck is altocumulus (Ac). The lumpy nature of the clouds indicates a layer of instability overhead caused by warmer moist layer aloft being lifted. It is also a sign of an approaching storm.

Altocumulus approaching from the west. Photo by Craig Johnson 3-17-2020.

Altocumulus approaching from the west. Photo by Craig Johnson 3-17-2020.

Next in the progression is the altostratus below. The cloud streaks indicate precipitation falling aloft. Notice the streaks below the cloud layer - a classic sign of precipitation. Because the air below the cloud base is very dry (surface dew points were in the upper 20s) it will take 6 to 8 hours for the precipitation to saturate the air and allow rain to reach the ground. By then surface temperatures will be above freezing so freezing rain is not expected.

Altostratus, Precipitation is falling aloft but not reading the ground, Photo by Craig Johnson, 3-17-2020.

Altostratus, Precipitation is falling aloft but not reading the ground, Photo by Craig Johnson, 3-17-2020.

What's in a graph? A lot!

I promised to occasionally write about the value of an automatic weather station. This is one of those occasions.

The first two graphs below show the wind speed and wind direction, in that order, from our weather station in Cedar Falls. The dates are March 6th and 7th. The 2 minute average wind speeds on both days were mostly less than 10 mph with a few periods exceeding 10 mph (blue line). But there were higher gusts (stars). The gusts exceeded 20 mph

Note a couple of things. First the winds were gusty during the evening of the 5th and early morning of the 6th (stars) before dying down during the day on the 6th. After the Sun came up on the 7th wind speeds increased again and became gusty (stars). Winds were from the WNW on the 6th but gradually decreased and became southeasterly during the day of the 6th. On the 7th winds increased from the south, becoming gusty after sunrise. This is a common pattern for wind speeds. Stronger winds aloft are not always felt at the surface at night because nighttime cooling separates the near surface air from the strong winds aloft. If winds (as in this case) begin to suddenly increase after sunrise it is likely that solar heating is mixing the air allowing stronger winds aloft to drop to the surface.

Wind_Dir_Speed_3-7-2020.PNG

Let’s look at the temperature (red), dew point (green), and relative humidity (blue) lines on the graph below and the pressure change on the bottom chart. Lets just look at March 7th beginning at 8:00 a.m. Notice how the temperature (red) started rising quickly after sunrise. The sharp rise was due to solar heating but enhanced by the mixing down of air aloft. As the air sank toward the ground it warmed at 5.5 degrees F for every 1,000 feet it descended. Temperatures warmed to near 60 in the afternoon.

At the same time the relative humidity decreased. As air warms its capacity for water vapor increases. Since more water could be in the air at 60 degrees than at 40 degrees, the relative humidity decreased from 60% in the morning to less than 30% in the afternoon.

Finally, the dew point increased slight during the day. The dew point is one way to measure the amount of water vapor in the air. It increase slightly because the southerly winds were bringing slightly higher dew points into the area.

While all of that was going on the air pressure was decreasing as chilly high pressure was moving away from Iowa and lower pressure to the west was inching eastward. The pressure change chart shows this clearly.

All of the factors measured and shown on these charts are related to each other and to changes in the atmosphere over the United States. Forecasters use these changes, along with other data, to create daily weather forecasts. Data from automatic weather stations is one tool that is used to make those forecasts.

Wind_Dir_Speed_T_RH_DP_P_3-7-2020.PNG

Looking from the top down and bottom up.

Visible GOES 16 Image courtesy of NOAA

Visible GOES 16 Image courtesy of NOAA

My favorite satellite images are visible images. A visible image is created using the visible light spectrum so we see what someone looking down on the Earth from space would see. (OK…it’s a lot more complicated than that but for our purposes I will leave it at that.)

Visible images show us Earth’s land forms; bodies of water, clouds, forests, grasslands, and more. This image above was created at 10:16 a.m. CST (16:16Z) this morning. Lakes, rivers, forests, snow cover, and clouds are all visible. Lakes with open water are dark while ice covered lakes are white. Rivers are dark, either due to water and/or trees lining the river valleys. Dense clouds obscure land forms and thin clouds allow land forms to show through. If this image were put in motion the clouds would become immediately apparent; they would move while land forms were remain stationary. Go to the satellite image section on our home page and you will find images like the one above that you can put in motion. Look for the GOES 16 and 17 images.

There are high clouds over northeastern Iowa in the above image. A thin sliver of clouds extends south to the Iowa River Valley in east central Iowa. Under that sliver of clouds is Cedar Falls, Iowa. The two pictures below were taken at 11:33 a.m. CST under those clouds shortly after the dense part of the clouds moved east of Cedar Falls.

Photo Copyright 2020 by Craig Johnson looking SSW.

Photo Copyright 2020 by Craig Johnson looking SSW.

Photo Copyright by Craig Johnson looking NW

Photo Copyright by Craig Johnson looking NW

These are good examples of dense (top photo) and broken cirrus. When looking at the satellite image above, the broken area of clouds that are slightly west of the main cloud area protruding south into northeast Iowa had moved over Cedar Falls when these photos were taken. It is that broken patch of clouds that shows in these pictures. You need to look very close at the cloud detail to see it. You are looking for a very tiny patch of broken clouds that look like waves.

Smeared Cirrus

Photo by Craig Johnson, Copyright 2-23-2020

Photo by Craig Johnson, Copyright 2-23-2020

The sky looked chaotic as winds aloft smeared cirrus across the sky. Upward motion aloft was enhancing the formation of cirrus. This photo shows streaks of cirrostratus, ripples of undulating cirrus, and formations of unusual lumpy forms cirrus. Temperatures at the cloud level were slighty below zero (Fahrenheit). The wispy look to the clouds indicates mostly ice crystals were present even though tiny liquid water droplets are possible down to -40 degrees.

Here is a question for you. Do you see the eagle silhouetted against the sky in one of the trees?

Clouds with a Message

IMG_2906_4x6_96dpi.jpg

Photo by Craig Johnson, Arches National Park, Utah, Copyright 2012

Many landscape photos are stunning. The contrast in color, composition, and setting all add up to an eye-catching scene. But photos sometimes have special qualities for other reasons. This photo, taken in Arches National Park, enjoys distinct color variations and is in a majestic setting. On top of the, we hiked to this spot and no one else was there. The silence was deafening. How often do you get a national park to yourself? It was a special day.

I was after cloud photo to add to my already voluminous collection. These altocumulus were drifting across the desert landscape teasing the life below. It was a hot dry day but moisture laden mid-level clouds were signaling possible showers. Weatherwise people watch the sky for signs and the sky almost always has an answer. In this case the weather followed through! There were afternoon showers in Arches National Park.

Turn Around

Photo by Craig Johnson, Copyright 2012

Photo by Craig Johnson, Copyright 2012

There is a rule of thumb in photography: Don’t forget to turn around! That’s what happened with this photo. On the way through Arches National Park, UT to the campground we looked behind us. And there it was; a dying storm at sunset! It was big, it was impressive and it was fading in a hurry. So don’t forget. When you are taking pictures be sure to turn around. The best photo may be behind you!

This storm was falling apart but it was so close and so big it filled the frame. Bathed in colors from the setting Sun it was a 3-dimensional wonder of a boiling cloud running out of steam. This “has been” cumulonimbus soon vaporized into nothing in the dry Utah air.

Contrasting Photos

Photo by Craig Johnson, copyright 2012.

Photo by Craig Johnson, copyright 2012.

English writer John Ruskin (1819-1900) famously said: “There is no such thing as bad weather, only different kinds of good weather!”

Good photos may be taken on “good days” and “bad days.” The top photo was taken on September 26, 2012 at Arches National Park, Utah. The bottom photo was taken at nearby Canyonlands. Both photos have a story to tell.

These photos have a different feel. The top photo reveals an afternoon of showers and lightning; the bottom photo sunshine and distant storm clouds. But its all a matter of perspective. Rain was welcome in the desert and both photos showed the rain. One featured the rain while the other featured sunshine. Both locations had rain. It all happened on the same late September day in 2012.

Photo by Craig Johnson, copyright 2012.

Photo by Craig Johnson, copyright 2012.

Is it Warmer or Not as Cold?

Practice makes perfect! For all of our station model plotters, let’s look at the north central USA. The large arctic high pressure system continues to dominate the central USA north into Canada. Notice the cold temperatures over the Upper Midwest. The cold dry air is producing generally clear skies. South of the map, Gulf moisture is spreading north from east Texas to the Mid-Atlantic states. Look for stations reporting light rain and drizzle. Look for reports of light fog downwind from the Great Lakes in the colder moist air.

Map plotted using Digital Atmosphere software from Weathergraphics.com.

Map plotted using Digital Atmosphere software from Weathergraphics.com.

Compare this surface map with yesterday’s (scroll down). The high pressure center has been nudged slightly east but a strong southwest flow has spread out onto the northern and western plains. A “warm-up” is underway. There is still light snow and clouds in the moisture laden air downwind from the Great Lakes and also from Kansas to Texas.

Can we really call what’s coming warmer? It will certainly be warmer. With a 35 to 45 degree rise in temperature from last nights lows it is certainly warmer but with the winds it will feel “not as cold.” There will still be a solid chill in the air. One thing is sure. We are toward spring and summer so warmer weather is just around the corner, one way or another.

Advanced Exercise. For station model plot users: What to look for on the map today.

Look for stations reporting light snow in Indiana, Kentucky, and Lower Michigan. What are the wind speeds and wind direction from the Dakotas to Nebraska and Montana? And check out the pressure tendencies. Where have pressures been rising and where have they been falling? Where are skies clear?

Hints:

  1. Look for cloudy skies, then see where precipitation is falling.

  2. For strong winds look where the pressure gradient (change in pressure) is greatest; where the isobars (thin dark lines) are closest together.

  3. For pressure rising and falling look at the tendency symbols. The symbols are shaped to show steady, rising, falling, rising then steady, rising then falling, falling then rising, falling then steady. And skies are often clear under high pressure areas.

  4. Finally, notice the general wind direction around the high pressure area. See if you can spot the clockwise motion.

If you want to learn how to read station model plots scroll up this page and click on the Station Model Plot link.

Snow - Arctic Air - Change in the West

Use your decoding skills to find the features mentioned in the briefing below. If you don’t know how to read the map start by learning about station model plots on our home page. It’s easy once you get the hang of it. It’s a whole new world waiting for you and its easy to learn. This is fun for children and adults.

Surface Plot 2-14-2020 at 0400 CST. Plotted by Digital Atmosphere; www.weathergraphics.com

Surface Plot 2-14-2020 at 0400 CST. Plotted by Digital Atmosphere; www.weathergraphics.com

Arctic high pressure is centered over northern Missouri this morning with northerly winds east of the ridge line, southerly winds west of the ridge, with Pacific air to the west. Sub-zero temperatures are observed under the high in the center of the region with teens under the clouds to the east. LIght snow is falling downwind of the Great Lakes. Temperatures in the 30s are found down wind of the northern Rockies in Montana. Clouds are drifting north on the southwest quadrant of the high. Look for the milder air in the west to overspread the the region as the high pressure retreats to the east.

That's What Weather Systems Do!

SFC_Map_TOP_12-30-2019_01Z.png

The low pressure center that reorganized over southeastern Colorado and southwestern Kansas has not moved further north today. It is now located over southern Minnesota. The station model plots so the mild air east of Iowa while colder air is overspreading the state from the west and southwest. Even colder air is moving south across the Dakotas, Nebraska, and Kansas. As the warm and cold air is drawn into the low center the air masses mix and gradually dissipate the temperature contrast over the Midwest. That’s what weather systems do and that is why they exist!

Learn about how to decode the station model plots on these maps here on WeatherBriefing.com. Click HERE and scroll down.

Follow the storm and learn how to decode station model plots.

Surface map at 2200 CST, Saturday, December 28, 2019

Surface map at 2200 CST, Saturday, December 28, 2019

The low pressure continues to move northeastward. Look at the station model plots and notice the large temperature differences. Readings are in the 20s and 30s north and west of the low center with 50s and 60s to the southeast.

Learn how to read the plotted data by clicking HERE and scrolling down.

The Wind has Changed

Weather observation at Cedar Falls, IA at 8:30 p.m. CST, Friday, 27 December 2019.

Weather observation at Cedar Falls, IA at 8:30 p.m. CST, Friday, 27 December 2019.

The wind has now turned around to come from the southeast. This is the third of three signs indicating that a storm is brewing. It’s now a matter of just how big. All signs, based on computer model projections suggest a major low pressure system will move from northeastern New Mexico and reorganize over southeastern Colorado before heading toward Iowa and southern Minnesota.

High pressure continues to shift eastward with its center located over southern Lake Michigan. High clouds have spread over northeast Iowa and mid-level clouds have reached southern Iowa. The storm will gather strength as it moves northeast and draws an unseasonably amount of moisture into the system from the Gulf of Mexico.

The map below shows mid-level cloudiness now over southern Iowa, rain, freezing rain and snow in southwestern Nebraska, and rain in Kansas. Notice the C110 (ceiling 11,000 feet) at Ottumwa, C100 (ceiling 10,000 feet at Lamoni, and C90 (ceiling at 9,000 feet) at Omaha, NE. Low level moisture is moving northward from the Gulf of Mexico with surface dew points in the 40s and 50s over Oklahoma and Texas and 50s and low 60s in Arkansas. This moisture will be lifted as it moves north over colder air setting the stage for wide spread rain and thunderstorms in the warm air east and south of the low center track with a large area of moderate to heavy snow expected to develop to the left of the low center path.

SFC_TOP_12-27-2019_02Z.gif

Meanwhile the pressure continues to drift lower at Cedar Falls in northeast Iowa. The rate of pressure fall will accelerate once the low organizes over southeast Colorado and moves over the Southern Plains toward Iowa. The weather will get more interesting by the hour overnight into Saturday.

If you are not familiar with the station model plots shown on the map above go to the Station Model Plot explanation found on this website HERE. Just scroll down until you come to the station model section.

Pressure_Graph_12-27-2019_2100CST.PNG

What’s coming next? Temperatures over Iowa will remain steady or rise slowly tonight into the day on Saturday. Rain will spread into western and northern before dawn with some ice accumulation where readings stay below freezing. The low center should become established over southeastern Nebraska during the night and begin moving east then northeast into Kansas toward Iowa. Pressures will continue to fall ahead of the low center. Cloud ceilings will lower over Iowa and points southwest as the precipitation shield advances to the northeast.

Cirrus Heralds the Storm

2019_12_27_2982_Cirrus_4x6_96dpi.jpg

Photo by Craig Johnson 12-27-2019, Cirrus Heralding the Storm

In the previous post we looked at the first sign of an approaching storm; a drop in air pressure. This time it’s the first sign in the sky. Cirrus clouds spreading northeast over Iowa have reached Cedar Falls. Next we will look for another sign; a switch in the wind from westerly to southeasterly.

The map below shows the weather at 6:00 p.m.

SFC_Map_TOP_12-28_2019_00Z.png

Going Down!

A large storm is forming along the eastern slope of the Rockies this morning. The first sign has just raised its head at Cedar Falls, Iowa. That sign is found in the barometric pressure trace.

Look at the chart below. Beginning on the far left side lets follow the trace. The pressure decreased until 2:00 p.m. on Christmas Day when it reached a low of 1004.0 millibars. At that point you will notice a small jump that began a small unsteady rise into the early hours of the 26th. At just after midnight (12:50 a.m.) on the 26th a steeper climb began. It continued until 10:20 a.m. this morning when the peak of 1024.2 millibars was reached. Then the pressure trend reversed itself. It is now decreasing. This marks the beginning of an expected sharp fall in pressure as a storm center deepens over SE Colorado and moves toward Iowa.

Barometric_Pressure_12-27-2019.PNG

The weather map below is at 10:00 CST this morning. High pressure is centered along the Iowa-Missouri border. As the high moved across the Midwest the pressure at Cedar Falls increased - as shown on the graph above. Notice the calm winds under the high center. Winds are from the NW to NE to the south and east of the center and west to southwest to the north. High pressure rotates clockwise in the northern hemisphere. Further west winds are from the east in Kansas, western Oklahoma and western Texas as air moves toward the low pressure center forming just off the SW edge of the map. Air is descending out of the high and rising into the low.

The air pressure will go down (decrease) as the low intensifies and begins its trek to the northeast. Look for a major snowstorm to develop to the left of the storm center track and heavy rain to fall to the right of the path. Thunderstorms will likely develop east of the storm center.

By the way, the first sign of a storm at Cedar Falls appeared in the change in barometric pressure. Looking out the window the sky is sunny! It’s a beautiful day! There are no signs in the sky yet but they are coming. There are no signs in the wind yet either - but those signs are coming too!

If the data plots on this map are new to you go to the Station Model Plot section on this web site to learn how to read them. There is a lot of information available in each station plot.

SFC_Map_TOP_12-27-2019_16Z.png

Read a Weather Map

Map plotted by Digital Atmosphere available at www.weathergraphics.com.

Map plotted by Digital Atmosphere available at www.weathergraphics.com.

Using the station model plots on this map let’s check on the weather at several cities. If you are unfamiliar with the station model plotting code and plotting scheme it is found HERE on the Weather Briefing website. I will include the answer in the first few plots.

  1. What is the temperature at Omaha, Nebraska? (19)

  2. What is the weather at Omaha? (light snow)

  3. What is the visibility at Omaha? (5 miles)

  4. What is the cloud ceiling at Omaha? (1500 feet)

  5. What is the dew point at Omaha? (13)

  6. What is the air pressure reduced to sea level at Omaha? (1017.7 millibars)

  7. What is the sky condition at Omaha? (Overcast).

  8. What is the wind direction at Omaha? (from the north)

  9. What is the wind speed at Omaha? (approximate 10 knots or 8-12 knots)

  10. What kind of front extends from Montana to northwestern Nebraska? (warm front)

  11. What kind of front extends from northern Arkansas to southern Illinois (cold front)

  12. Where is there a center of high pressure? (southern Manitoba)

Here are questions that you can answer:

  1. What city in North Dakota has a temperature of -13?

  2. What cities in North Dakota report clear skies?

  3. What cities in Minnesota report light snow?

  4. What cities in Kansas report northerly winds? (from the north)

  5. What cities in Kansas report easterly winds?

  6. What cities in Utah report calm wind?

  7. What city in Montana reports 1/8th mile visibility in rime depositing fog?

  8. What city in Idaho reports an air pressure reduced to sea level of 1011.3 millibars?

Three Dimensional Clouds

GOES 16 Visible Satellite Image courtesy of NOAA 1401Z 10-31-19 (9:01 a.m. CDT)

GOES 16 Visible Satellite Image courtesy of NOAA 1401Z 10-31-19 (9:01 a.m. CDT)

There is much to appreciate about this satellite image. Let’s look from right to left. First notice the shadows that are being cast to the west of each cloud layer. Where ever there is a cloud that is higher than the clouds to the west you will see shadows cast on the lower clouds. The shadows bring out the texture in the cloud tops.

The white in eastern Kansas, Missouri, and south central Iowa is snow on the ground. Notice the rivers and lakes showing through the snow. In Iowa a thick higher cloud layer covers the eastern part of the state. Its western edge is casting a shadow on a smooth lower stratus cloud layer to the west. In the meantime, western Minnesota, western Iowa, western Missouri, most of Oklahoma, all of Kansas and Nebraska, most of South Dakota and all but northwestern North Dakota are sunny. The stratus layer extends into eastern Minnesota, Wisconsin, and Upper Michigan and Ontario. Look closely and you will see other clouds over Kansas, southern Nebraska, and central South Dakota and eastern North Dakota. As the Sun rises those clouds will become more visible.

By the way, what you don’t see is a lower cloud layer over eastern Iowa eastward which is covered by a higher cloud layer.

Weather Depiction 1400Z (9:00 a.m. CDT) 10-31-2019. Map plotted by Digital Atmosphere available from www.Weathergraphics.com.

Weather Depiction 1400Z (9:00 a.m. CDT) 10-31-2019. Map plotted by Digital Atmosphere available from www.Weathergraphics.com.

The map plot above is a weather depiction chart. It shows the weather station location (a circle or a box), cloud cover (how much the circle or box is filled), current weather (asterisks or dots for snow and rain, and cloud ceilings). For example, a plot that includes C14 indicates a ceiling of 14 hundred feet. Just mentally include two zeros after the 14 which gives you 1400 feet. This is a simplified version of the full station model plot that is explained on this website. On this map, Chicago reports light snow, Iowa City has light snow, light rain is falling at St Louis, and moderate rain is reported at Fort Wayne, Indiana. Notice the clear circles and boxes to the west. In those areas the observation plot indicates either clear or fair skies.

Compare the data plot with the satellite image and you get a more complete picture of the cloud cover. The satellite image shows shows high clouds and lower layers but the first opaque cloud layer obscures what is below. The weather observations show the lowest opaque cloud layer but no layers above it.

Snowy Satellite Scene

Satellite image courtesy of NOAA.

Satellite image courtesy of NOAA.

Can you see the snow on the ground?

The quality and timeliness of satellite imagery has improved dramatically since the launch of the first GOES satellite on October 16, 1975. The image above was obtained this morning at 1531Z (10:31 a.m. CDT) and it showed snow on the ground from central Iowa and northern Missouri into northwestern Illinois and south and east Wisconsin. The image also has widespread cloudiness over western Iowa into Minnesota and from South Dakota to Nebraska, Missouri, Illinois, Tennessee, and Arkansas.

Back to the snow. Take a close look. Snow cover has a much different look than clouds. Snow appears smooth while clouds have a variety of textures. Trees are visible where snow covers the ground, clouds (other than thin cirrus) hide surface features. Snow covered river valleys are visible because trees line the streams. A fresh snow fall over bare ground has a well defined edge where the snow cover ends.

In the photo above notice the blanket of white across Iowa and Wisconsin and nearby areas of Missouri, and Illinois. There is a distinct end to the snow cover on both the north and south sides of the snow area. Notice the path of the storms as outlined by the snow cover. Notice the streams and lakes in the image. The detail is amazing. The photo illustrates how a slight movement in the storm’s path maked a difference in how much snow is received at any location.

Satellite images give us great views of Earth from space and help us identify processes in the atmosphere by noting the shape, thickness, and patterns in the clouds. By comparing the clouds to computer model forecasts we can adjust forecasts based what is seen by the satellite. Satellites, radar, atmospheric soundings, surface observations and other data give forecasters tools to improve weather forecasts.

Read a brief history of the GOES satellite program here.