
Clouds of the Day - Saturday, August 15, 2020
/Cirrus clouds with gravity wave ripples - looking NW
Wide angle view of cirrus with gravity waves. Several birds are visible in flight. Looking NW
Cirrus spisatus in foreground. Looking SSE
To purchase our 24” x 36” full color cloud chart, go to our online store. It is suitable for framing in a standard 24” x 36” frame.

Learn how to identify clouds by following the Clouds of the Day posts below.

Cirrus clouds with gravity wave ripples - looking NW

Wide angle view of cirrus with gravity waves. Several birds are visible in flight. Looking NW

Cirrus spisatus in foreground. Looking SSE

Cumulus with cirrus above upper right. Looking SE.

Cumulus with cirrus above. Looking SE.

Cumulus and cumulus mediocris with cirrus above. Looking High East.

Cirrus in bands moving from right to left (looking south)

Cirrus with a patch of altocumulus left. Looking ESE.

Cumulus in the foreground

Cumulus with a patch higher altocumulus upper right

Few cumulus lowr right with altocumulus center and top. Band of altostratus bottom

Cumulus congestus

Cumulus with altocumulus above

Cumulus with altocumulus above

Cumulus in foreground and higher altocumulus left

Altocumulus

Altocumulus in waves

Barometric pressure trace from Cedar Falls, Iowa for August 9th through August 15th. The sharp pressure jump at Noon on August 10th occurred as the Derecho side-swiped Cedar Falls. We experience the pressure rise but not the damaging winds. Almost immediately after the pressure rise it dropped quickly in the wake of the storm, reaching a minimum at mid-afternoon.

Radar image from the National Weather Service in Des Moines, Iowa captured as storm with classic Bow Echo formation swept across Iowa on August 10, 2020. Winds in excess of 100 mph were measured with sustained winds of 60 to 100 mph lasting for 60 to 90 minutes.
Notice the notches of weaker radar reflectivity on rear side of the storm. These are areas of strongly descending air dropping under the rain before exiting out the front of the formation. The rain cooled air accelerates downward as evaporation of the rain into the descending air carries stronger winds to the surface. The evaporation cools the air even more which increases its density causing the air to accelerate to the ground.
Approximately 80% of the buildings in Cedar Rapids were damaged. About 1/3 of Iowa’s corn crop was damaged. It remains to be seen how much of it will be available for harvest. The damage is so extensive that is it visible on weather satellite imagery.
The radar image is a screen grab from RadarScope sofware. Go to radarscope.com to purchase the software. The radar data is free from the National Weather Service.
Clear HERE to learn more about Derechos.
The photos below show clouds in layers. Cumulus clouds form in the lowest layer of the atmosphere; up to 6,000 feet (2,000 meters). Altocumulus are “high” cumulus, found between 6,500 and 20,000 feet (2,000 - 6,000 meters). High clouds are found above 16,500 feet (5,000 meters). High clouds are wispy mainly ice crystal clouds called cirrus. Cirrocumulus clouds consist of ice crystals and water droplets. All photos are taken by Craig Johnson from Cedar Falls, Iowa.

Bases of cumulus clouds are overhead with altocumlus visible above through the hole in cumulus right of center. Photo looking south.

Cumulus are visible with altocumulus above.

Cumulus are the low puffy clouds but streaks of altocumulus are visble above in the center. Photo looking south.

Cumulus below a higher layer of altocumulus. Photo looking east.

Again cumulus are low, altocumulus above in the middle level(upper right) and cirrocumulus and cirrus are high left of center. Photo looks high in the eastern sky.
Follow the progression from clear sky to scattered/broken cumulus clouds as low level temperatures become warmer than the convective temperature. When the convective temperature is reached air will rise without any mechanical assistance, much like a hot air balloon rises. If the rising air rises high enough to reach the condensation temperature cumulus clouds will form. That’s what happens in the photos below. When the becomes well mixed or the air temperature is cooler than the convective temperature the air stops rising. That also happened here and the sky cleared around sunset.
All photos taken in Cedar Falls, Iowa by Craig Johnson.

The day Dawns Clear - Mid-Morning Sky looking northwest

Beginning Cumulus - Late morning Looking South-southeast

Solar heating warms the ground, which warms the air, causing air to rise. The first sign of Cumulus - Mid-morning looking East-Northeast

Growing Cumulus - Late-morning looking South-southwest

More numerous deve3loping Cumulus - Just before Noon Looking South

Early afternoon cumulus looking north-Northeast

Mid-afternoon cumulus looking North-Northeast

Mid-afternoon Cumulus transitioning to stratocumulus looking northwest

Mid-afternoon cumulus and stratocumulus looking east

Closer view of stratocumulus looking east

Cumulus in the late afternoon looking south-southwest

Cumulus remnants under a deck of cirrus and cirostratus looking west

‘Fire at Sunset.’ Notice the cirrus filaments and a lower layer of altocumulus (left). The white spot is the moon just above the center on the right side.

The Sun had already set when this photo was taken.. The Sun was illuminating the clouds from below. The red hue is due to the the atmosphere filtering out most of they other colors in sunlight. The red light was being reflected off the cloud base.

Hurricane Hanna in South Texas. This is National Weather Service Radar from Brownsville, Texas. Notice the eye of the storm northwest of McAllen, Texas. The radar image was provided by RadarScope software available from radarscope.com.

Cumulus are in the foreground with altostratus/altocumulus in the background. The clouds in the background have both stratus and cumulus characteristics but appear to be in the mid-levels so are a mix of altostratus and altocumulus.

Cumulus are in teh foreground and altocumulus and altostratus are in the background.

Clouds form at different levels. In this photo we see clouds at three different levels. On top are cirrus (top left), in the middle are altocumulus (near tree tops left) and the lowest clouds are cumulus (bottom right). The next time you view the sky look for cloud bases at different levels.

Wispy cirrus, wavy altocumulus, and layered altostratus occupy the same sky in this photo.

Beautiful altocumulus cellular patterns.

More cellular Altocumulus patterns dominate this sky scene looking northwest.

Altocumulus high and ‘Low.’ The higher cells form a blanket over a lower layer with individual cells of altocumulus. The lower clouds appear darker because of shadows cast by the Sun (off the edge of the photo to the top) underneath thiese lumpy clouds.

The chaotic sky in these photos feature Cirrus, altocumlus, and and contrails (condensation trails).


The photos above were all taken on Sunday, July 19, 2020 from Cedar Falls, Iowa. The photos all show cirrus, altocumulus, and at least one contrail (condensation trail. Condensation trails are water vapor, a by-product of burning jet fuel, condensing out as water droplets or ice crystals in the cold atmosphere. The aircraft are usually flying above 30,000 feet as they fly-over Iowa. How cold is it up there? In the heat of summer temperatures are about -20 degrees C which is -4 F. Water vapor and ice crystals can co-exist at temperatures below freezing until temperatures reach -40 F (-40 C). That’s not a typo - -40 C and -40 F is correct!

Cumulus

Cumulus

Altocumulus and Altostratus

Stratocumulus under altocumulus and Altostratus

Cumulus at sunset

Large rolled Stratocumulus about 23 minutes after sunset. Photo is looking Southeast.
Hail from today’s thunderstorms almost reached the diameter of quarters. The largest I saw was similar to one hailstone on the deck near the top left near the pot with the yellow flower in it. National Weather Service radar from Des Moines indicated we were on the western edge of the hail path. Hail up to quarter size was expected.

Close up of hail on the deck. The maximum size was similar to a large marble. Most were smooth and round but I did see one that was jagged.


Cumulus congestus under a thunderstorm anvil. There was a large field of cumulus and cumulus congestus in the sky for much of the day. An upper level disturbance moved southeast out of Minnesota and South Dakota that prompted a severe thunderstorm watch followed by numerous warnings. As thunderstorms approached from the northwest the anvils overspread the sky above the cumulus field. It made for a chaotic looking sky as you can see.
Cumulus congestus under a thunderstorm anvil.

Cumulus under thunderstorm anvil.
A severe thunderstorm blew through Cedar Falls, Iowa between 1:30 p.m. and 2:00 p.m. Maximum wind gusts reached 70 mph with a maximum rainfall rate of just over 4 inches per hour. Rainfall totaled 1.88 inches. More than 7000 customers in Waterloo were without power and 2000 customers in Cedar Falls were without power. There were many trees and power lines down throughout the cities and rural areas.
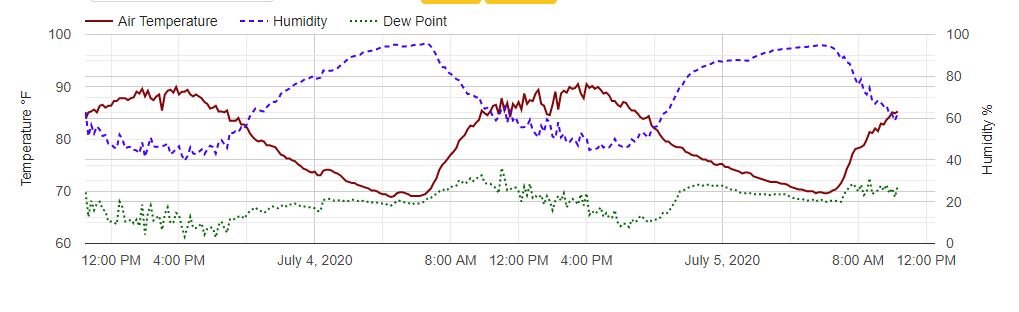
The meteograph above is from the Weather Briefing, LC weather station. It graphs temperature, dew point, relative humidity and time during a 48 hour period. Graphs are very useful for visualizing relationships between weather elements. This chart is useful for students to visualize the relationships.
The solid red line is temperature, the dotted green line is dew point, and the dashed magenta/blue line is relative humidity. Time is plotted on the horizontal axis. Temperature is plotted on the left vertical axis and relative humidity is plotted on the right vertical axis.
Temperature and dew point change independently of each other. That is, either one or both can change without affecting the value of the other. On the other hand, relative humidity is determined by the temperature and dew point. If either temperature or dew point (or both) change, the relative humidity will change. This sounds redundant but relative humidity is - relative. It compares how much water is in the air with the amount needed to saturate the air. Therefore, the amount of water in the air at 100% relative humidity is different at different air temperatures. There is much more water in the air at 100% humidity at a temperature of 70 degrees than at 30 degrees.
Temperature is sensible - we feel it change. Dew point is a measure of water vapor in the air. It is also sensible. High dew points make us uncomfortable because our bodies have a harder time keeping cool. Lower dew points occur when the amount of water air in the air is low. The dew point is the temperature at which dew would form if the air cooled. Dew points are higher when there is more water in the air.
For example, if the temperature is 80 and the dew point 70, the relative humidity is 72%. The air “contains” 72% of the moisture it can “hold” at that temperature. If the temperature cooled to 70 degrees the relative humidity would be 100% and moisture would condense as dew or a cloud.
Fog is a cloud that forms near the ground. It indicates the relative humidity is near 100%. If the temperature warmed to 90 degrees and the dew point stayed at 70 the relative humidity would be lower - 52%. Dew or fog would evaporate. It is important to know that relative humidity near the ground is usually different than it is higher in the atmosphere. If a day is sunny with scattered clouds the relative humidity is at or near 100% where clouds have formed. It is lower where clouds have not formed.
Referring to the meteograph, notice the dew point did not change significantly from midnight through about 6:00 a.m. on July 5th. However, the temperature cooled - which raised the relative humidity. When air cools and the dew point is unchanged, relative humidity increases.
The concept of relative humidity may be difficult to understand but knowing the relative humidity is important. Low relative humidity makes it easier for water to evaporate. Dry air dries soil, vegetation, and our skin. Notice how quickly clothes dry outside on a low humidity day. Low relative humidity and strong winds dry out vegetation in a forest. When fuels are dry the danger of wildfires increases.
If you want to delve into the scientific explanation of the relationships between temperature, dew point, and relative humidity click HERE.
NOTE: Air does not “hold” water. Other gases in the air, in order of the amount are: Nitrogen (78.09%), Oxygen (20.95%), Argon (.93%), Carbon Dioxide (.04%) is a trace gas along with a few other gases. Water vapor is a variable gas because it averages about 1% of the air by volume in the lower atmosphere and about .4% in the entire atmosphere. In some locations it can be as high as 4%.
Water vapor is different than the other gases because it is variable. Like all other gases it exerts pressure. If the pressure of the water vapor exceeds its saturations value for the current temperature it condenses. The vapor changes to a liquid (water) or a solid (ice). When water vapor condenses it may form a cloud of water droplets or ice crystals, depending on the temperature. Water may exist as a liquid in the atmosphere down to -32 F.

Altocumulus

Altocumulus above cumulus

Altocumulus above Cumulus

Unusual circle of altocumulus with cumulus below

cumulus and cumulus congestus below altocumulus

Closer view of cumulus in foreground and altocumulus above

Looking at the base of cumulus congestus

Cumulus congestus in foreground and altocumulus/altostratus above

Cumulus congestus growing into and altostratus/altocumulus layer
This was a day with a large variety of cloud types - all with their own story. Text will be added to tell the story.

Cirrus

cumulus congestus (congested cumulus) group

altocumulus/altostratus (part cellular and part stratus layer)

Cumulus and cumulus mediocris under an altocumulus layer (mediocre size cumulus)

Cumulus congestus

Altocumulus above developing cumulus congestus

Altocumulus

altocumulus

Altostratus

Cirrus above ragged cumulus fractus

cumulonimbus with cap cloud

Cumulonimbus close-up

Cumulonimbus

Arcus - shelf cloud with laminar banding above

Remnants of the arcus viewed from underneath. Red glow in the distance is apparently from an opening or thin cloud layer in the distance. This photo looks north. The Sun had already set in the northwest about 20 to 30 minutes before photo was taken.

This cumulonimbus was located southeast of Waterloo easily visible from Cedar Falls. Notice the cap cloud at the top which is caused by the storm updraft lifting a layer of air as the layer is blown over and around the storm top much like water flowing over a rock in a stream. As the layer is lifted there is enough moisture to create the clouds as it cools due to the upward motion.

Here are two radar images from the National Weather Service Doppler Radar in Des Moines. The storm is plainly visible on radar southeast of Evansdale, Waterloo, and Cedar Falls, Iowa. The storm core with the heaviest rain is located in the area of the red echo.
The radar image below is the Enhanced Storm Top product from the radar. The dark blue indicates a top of about 28,000 feet.


This photo, taken after sunset on Sunday, June 21st, shows a shelf cloud approaching Cedar Falls from the northwest. A broad area of thunderstorms was passing to the north. As the individual cells moved to the northeast cool outflow spread south. Since the outflow was weakening, this structure was breaking up as it approached. Winds gusted to 18 mph at the airport. Overnight several storm systems cross the area with heavy rain. Flood warnings are in effect today. There has been 5.42 inches of since the 19th. The above cloud looked a lot worse than it was.
The chart below shows the location of high and low pressure at about 18,000 feet this morning at 7:00 a.m. CDT. The red dashed lines are the temperatures at that level in degrees Fahrenheit. Notice the warmer temperatures are located within high pressure centers and the colder temperatures are associated with low centers.
This chart shows the upper flow crossing the West Coast and meandering into Canada then flowing to eastern Canada. over This pattern with a meandering flow and closed high and low pressure circulations does not change position quickly. That means the weather you had yesterday is the weather you have today and the weather you have tomorrow.

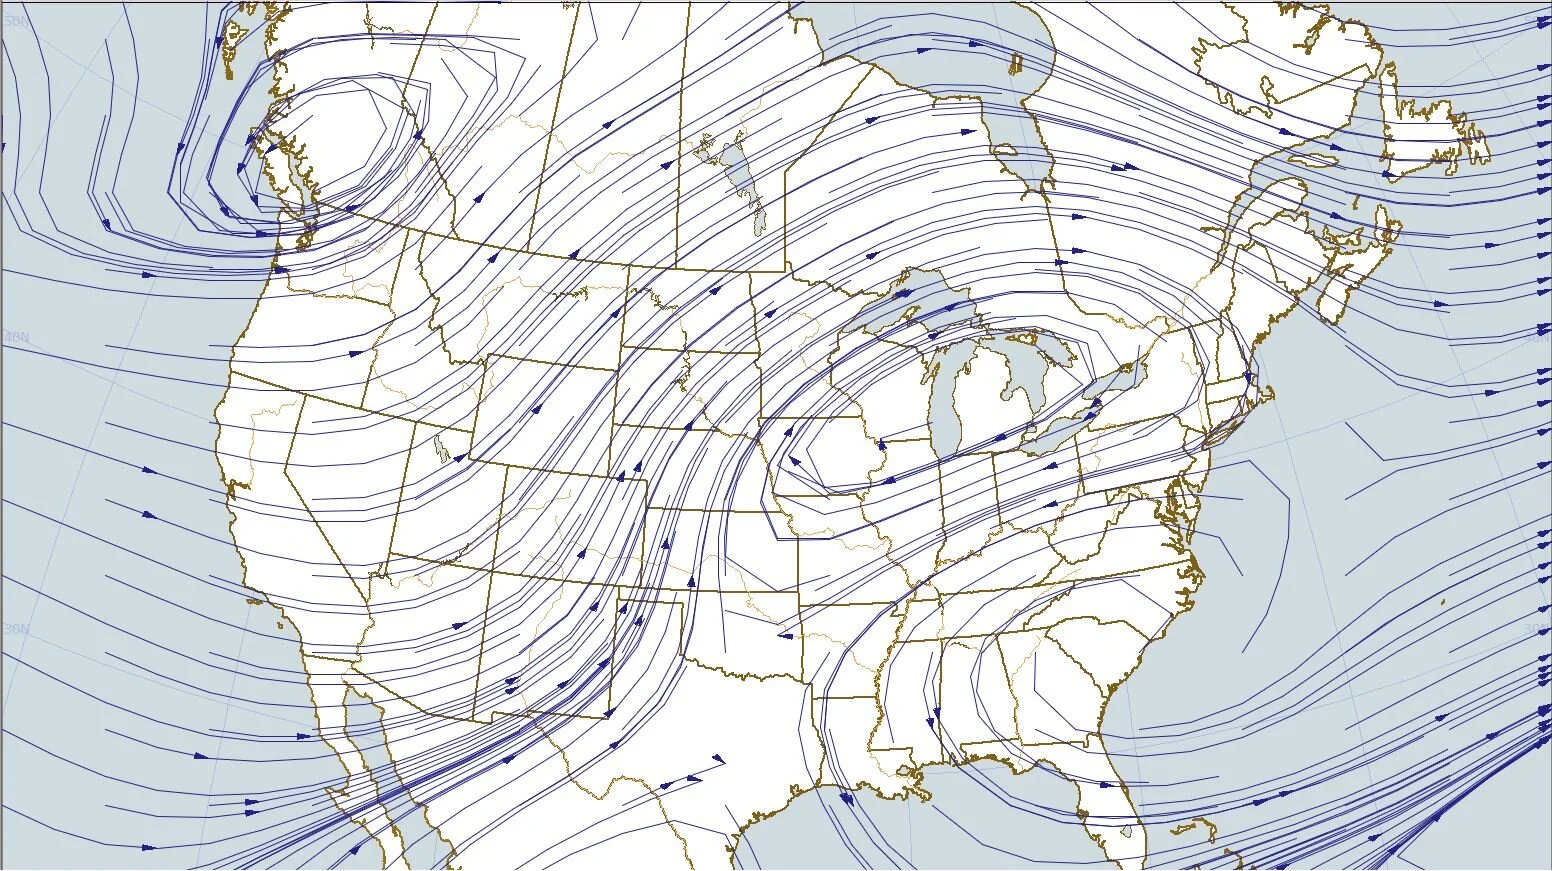
The next chart shows the streamlines at about 18,000 feet. It is a snap shot of the wind direction at 7:00 a.m. CDT. Winds are blowing clockwise around high pressure and counterclockwise around low pressure and illustrates the closed circulations that move very little from day to day.
The next chart shows the surface weather map with the temperatures in degrees Fahrenheit shown by red dashed lines. Notice the warmest air at the surface is over the Plains and the coldest air is along the east coast and in the Pacific Northwest. The warmest temperatures are over the Plains in a southerly flow while the coolest air is under the cool low pressure aloft.
Because the upper flow is not changing position the weather at the surface is not changing much either.

The final chart shows the streamlines at the surface at 4:00 p.m. CDT this afternoon. Surface winds are from the south over the Plains bringing warm air northward. Cooler air is coming off the Atlantic Ocean into the eastern U.S. and also spreading inland from the Pacific Ocean into the western U.S.

The four maps above were plotted using Digital Atmosphere available at www.weathergraphics.com.
The map below shows weather advisories in effect this evening. To see the latest advisories go to www.weather.gov.
The pattern shown on the maps has most of the “action” in the western U.S. with fire weather Red Flag Warnings out in parts of California, Utah, Arizona, New Mexico, and Colorado due to dry conditions, low humidity, and strong winds that would dry vegetation and fan flames. Wind advisories out up in the Dakotas and western Minnesota, Nevada, and California, frost advisories in Oregon and Nevada, winter storm conditions in Montana and Idaho, and air quality alerts in Colorado, Wisconsin, and Illinois. These advisories are issued because of long term effects of dry weather and the short-term conditions causing strong winds and a variety of different weather. For every action there is an equal and opposite reaction. In this case weather is balanced out by warmer air moving north and colder air moving south.

Copyright 2016-2024, Weather Briefing, L.C.
Cedar Falls, IA 50613, Phone: 319-215-2634, Email: craig@weatherbriefing.com