Clouds of the Day - Friday, September 25, 2020
/Stratus
Stratocumulus
To purchase our 24” x 36” full color cloud chart, go to our online store. It is suitable for framing in a standard 24” x 36” frame.

Learn how to identify clouds by following the Clouds of the Day posts below.

Stratus

Stratocumulus

Cirrus

Cirrus

Cumulus

Cumulus

Cumulus

Cumulus
Smoke from wildfires in the western United States covers much of the western half of the United States. Today a thin band of smoke extended from southwest to northeast Iowa. Cedar Falls, Iowa was on the northern edge of this band that was about 30 miles wide. The photos below tell the story.

Looking south directly into the smoke cloud.

Looking south southwest.

Looking south southeast under the smoke. Near the bottom of this photo a thin line of blue is visible. This is the blue sky near the southern edge of the smoke.

This is looking to the northwest. The right side of the photo is to the north away from the smoke - the sky is blue. The edge of the smoke is visible in the upper left quarter of the photo. From there to the south (as shown in the other photos) the sky was covered with smoke.
Cooler air is spreading south out of Canada into the Northern Plains to the Great Lakes today. A cold front has stalled from northern Kansas to Missouri and Illinois while the front continues to spread east to the lower Great Lakes and New England. The map below shows “streamlines” - a snap shop of the air flow at 6:00 p.m. CDT. Notice the streamlines converging along the boundaries in the middle of the nation. Overrunning of warm moist air from the south over the cool air arriving from the north will spread a large area of rain over the central part of the nation. The cooler air will back up against the Front Range of the Rockies with rain and snow likely. (Check local forecasts for details in your area.) Check the WxBlog to see how clouds were changing over northeast Iowa.
A large surface low is located over the James Bay area of northeastern Canada. See the post from this morning to see the temperature differences in the converging air masses. Also the photos below show the change in clouds over northeastern Iowa during the day as lift and arriving moisture thicken clouds leading to a broad area of rain.

This chart was generated by Digital Atmosphere. The software may be purchased at www.weathergraphics.com. The fronts and high and low pressure areas are shown. The streamlines are also shown. Streamlines show the direction of air flow as a snapshot in time.

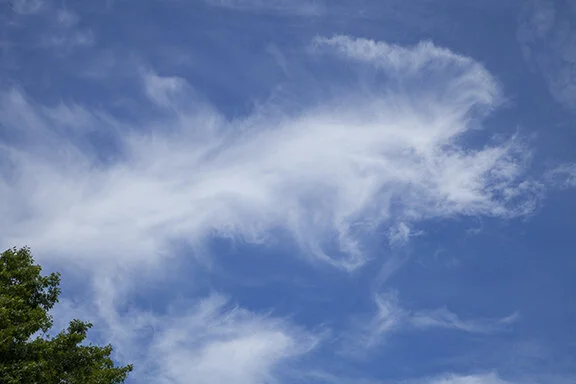
Cirrus this morning with streamers of ice crystals precipitating from the clouds. Notice the jet contrail?
This is a close-up of ice crystals streaming from cirrus floccus clouds. Floccus look like tufts of wool. The floccus here were dissipatting as the ice crystals fell out of the clouds.

A lower layer of Altocumulus moved overhead by early afternoon. This incidated a shallow layer of slightly unstable air in the midlevels.

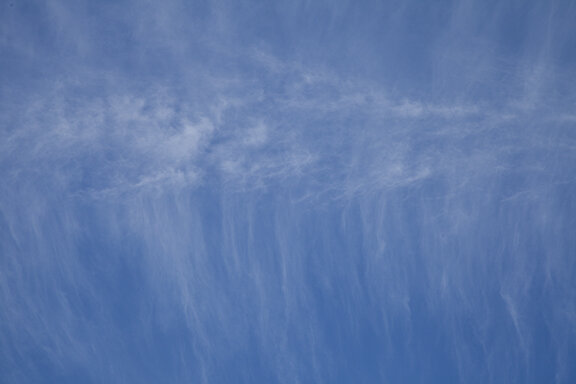
Another look at ice crystal streamers during the early afternoon.

Cirrostratus was evidident most of the day. This photo shows a thick layer but filtered sunshine weas reaching the ground.

Here are more streamers of ice crystals. The crystals appear to be moving horizontally aloft with upper level winds.

By late afternoon lower altocumulus clouds appeared at around 9,000 feet. This indicated more moisture and instability in the midlevels.

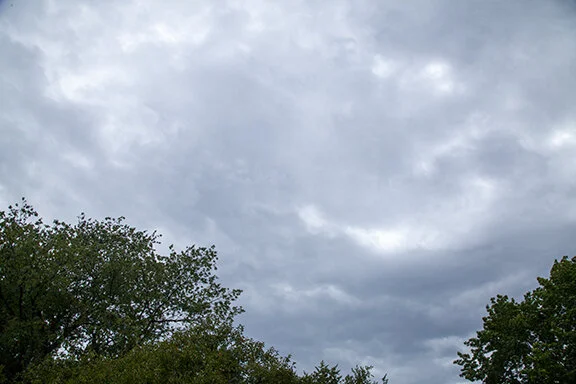
Altostratus undulatus (mid-level stratus with embdded waves) in the evening.

This is a close-up the altocumulus. Waves are evident in the clouds with the waves arranged in rows.

Altostratus undulatus (mid-level layer cloud with waves) in the evening.

Altostratus undulatus (Mid-level layer cloud with waves) in the evening.
The photos below begin with the remnants of thunderstorms moving from right to left in the first two photos. The final photo shows what is left of midlevel cumulus (altocumulus floccus) with streamers of ice crystals trailing the parent clouds. Altocumulus are midlevel cumulus clouds. In the final photo floccus are clouds that look like tufts of wool - small fluffy cloud elements. The elements here have mostly dissipated due to the precipitation.

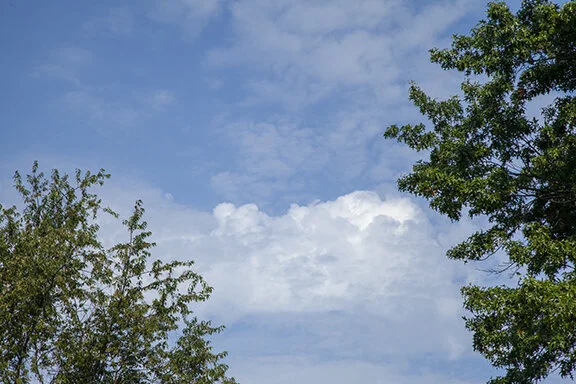
Stratocumulus (lower left), cumulus fractus (Center), Cumulus congestus base (top)

Cumulus congestus (right center), cumulus (lower left/center), cumulus base (top)

Remnants of altocumulus floccus with fall streaks

Map plotted using Digital Atmosphere software available from weathergraphics.com. The data is obtained at no cost.
Colder air is spreading into the central United States. Using your surface map decoding skills, what are the temperatures in Montana, North Dakota, South Dakota, and Minnesota? What are the temperatures in MIssouri?
Two cold fronts are being analyzed this morning at 9:00 CDT. One extends from eastern Ontario, Canada to southwest Kansa. The other extends from northern Lake Michigan to northern Wyoming. The coolest temperatures are behind the second front. The wind directions from southern Canada to northern Missouri are from the north and northeast. From Missouri to the Southern Plains and Mississippi and Ohio river valleys are from the south or southwest.
Learn to decode station models like seen on this map by following the link available on our homepage. The temperature is the number plotted to the upper left of the station circles.
The weather for the remainder of the week will turn much cooler in the central U.S. with substantial rainfall expected as warm moist air overruns the cooler air sliding south from Canada..

Altocumulus

Remnants of a contrail (condensation trail). These thin elements are ice crystals condensing from water vapor coming from a commercial Jet aircraft.

Altocumulus: puffy cloud elements in the middle level of the troposphere atmosphere.

Another example of altocumulus.

Altocumulus

Altocumulus

Cumulus congestus with showers distant bottom of photo

Cumulus congestus bases

Cumulus, with altocumulus Above
This day dawned with dense middle to high clouds overhead. The clouds initially had a cirrus look to them - given wispy edges and icy look to their structure. But after watching for awhile they grew quickly in coverage and were really high in the middle layer of the atmosphere. There were both cumulus and stratus structures in the mix. This is an example of clouds that have both cumulus and stratus structures. The sky does not always offer either/or decisions. Air flow can have many structures, there are often transitions between cloud types rather than a cloud being one basic type or another. That is one reason why cloud naming can be tough - it is not always clear cut. There is room to debate the types in the photos below.

Altocumulus and Altostratus

Altocumulus

Altocumulus and altostratus. Notice the ‘roll-type’ clouds near the bottom of the photo. These were obviously caused by a wave propagating through the layer.

Altostratus (top) with altocumulus (bottom)

Altocumulus

Altocumulus and Altostratus structures mixed together

Altocumulus because of the dominate puffy cloud element structure.

Altocumulus with some stratus structure lower left

A closer view of the above right photo.
Cumulus mediocris with altocumulus above

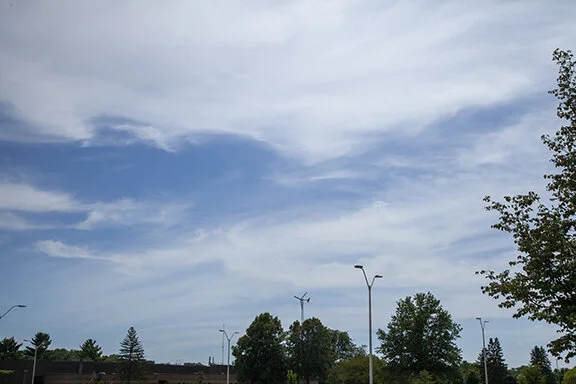
Haze is particulate matter such as smoke, dust or other dry particles in the air. It may also include aerosols which are very small liquid droplets. Haze may obscure both horizontal and vertical visibility. Our Iowa sky is normally a deep blue color in a clear atmosphere however prolonged periods of calm or light winds from the industrial states east of us bring haze our way. Agriculture can also generate dust particles when field work is underway - especially in the spring and fall.
Today a large high pressure area aloft has created stagnant conditions aloft from the central to southwestern United States. Instead of the deep blue sky we are used to, our sky is a milky color. In this case the haze is smoke from wildfires in the western United States.
A haze layer may be readily seen when flying. It is common for a layer of haze to exist below about 15,000 feet under the proper conditions. The height of the layer varies but when an aircraft climbs above the layer the sky suddenly turns blue with the haze visible below. High pressure areas encourage haze. Low pressure stirs the air and mixes out the particles - even using some of them as nuclei for condensation, rain and snow.
The photo above shows the haze very well - including the milky sky. The high pressure in this case is a large area of warm air aloft that is trapping particles in the lower atmosphere. It is also creating very warm humid conditions in the middle of the United States into the southwestern states. The air sinks through a high pressure area causing the air to warm. Warm air aloft suppresses rising motion and therefore storms are also suppressed. Storms are occurring around the northern and southern edges of the high pressure in the central U.S. where the atmosphere is unstable during the later afternoon into the nighttime hours.
Below is the 500 millibar chart from (8-25-2020). This chart depicts the wind and temperature at roughly 18,000 feet. I say “roughly” because the chart is not at a constant height. Instead, it is at a constant pressure of 500 millibars which is near 18,000 feet. In some places the high of the 500 mb pressure is higher and lower in other locations. Winds are strongest where the black lines are closest together. If you know how to read the wind barbs you can see that winds are less than 10 knots (11.5 mph) near the center of the high pressure over Colorado and New Mexico. Winds of 50 knots (58 mph) are measured over Green Bay, WI, Gaylord, MI, and Spokane, WA. It is the stagnant winds and sinking air in the high pressure that trap particulate matter.
The air is flowing from west to east from the Pacific Northwest then along the Canadian border and across the Great Lakes. The flow is turning clockwise around the high center. The wind barbs are pointing in the direction of flow with the flags at the back of the symbols. Hurricane Laura is located just west of Cuba. The red numbers are the 500 mb temperatures in degrees Celsius. Use a temperature conversion calculator on the internet to convert to degrees Fahrenheit if you like. You will find the warmest air aloft is near the center of the high and it is cooler to the south and much cooler to the north.

500 mb Upper Air chart is courtesy of NOAA and the National Weather Service.

Approaching Thunderstorm (Cumulonimbus)

Rain showers obscuring building cumulus congestus

Altocumulus

Altocumulus

Back end of departing Cumulonimbus

Cumulus congestus (center) and edge of cumulonimbus (right).

Dark cumulonimbus approaching from the right
There is a thin obscuration visible in the photos below. It is a hazy patch that partially obscured the altocumulus above it. It appears to be ice crystals precipitating below a clearing in the altocumulus. The clearing is most likely caused by the ice crystals from a jet engine exhaust seeding the altocumulus and causing the cloud to precipitate and dissipate.

Altocumulus with cirrus above and a thin obscuration below.

Altocumulus with thin obscuration below.

Altocumulus with Sun visible top right and thin obscuration visible left half.

Altocumulus with thin obscuration visible top left.
Cumulus bases with some fragments of cumulus

Altocumulus

Altocumulus
The photos below include two uncommon cloud names; Cirrus floccus and cirrus spissatus. The floccus cloud type resembles tufts of wool. Spissatus are dense patches thick enough to obscure the Sun. It is the only cirrus cloud type capable of blocking the Sun from view. The other types allow at least the disk of the Sun to show.
Cirrus with cirrus spissatus.

Cirrus with cirrus spissatus and cirrus floccus

Cirrus with cirrus spissatus

Cirrus with cirrus spissatus
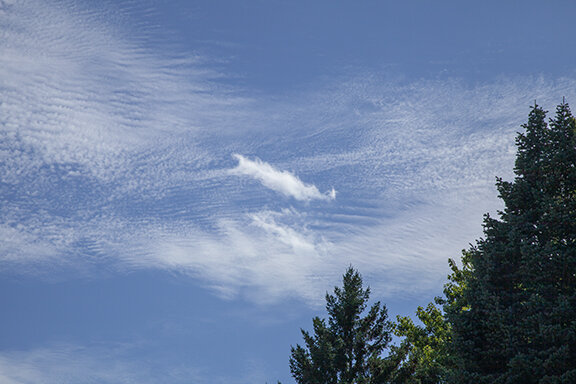
How do we determine cloud types? We look at them to see their shape and estimate their altitude. Most often the type of cloud is easy to identify - is it puffy, layered, or wispy? About how high is it? However, in some cases identification is not so easy. The photos below provide examples of clouds that look very similar. The clouds are located either at the top of the middle cloud level or the bottom of the high cloud level. They could be middle or high clouds. It becomes an educated guess. The same problem occurs when clouds are near the top of the low cloud level or the bottom of the middle cloud level. Are they middle or low clouds?
It is helpful if an airport is near by. Cloud heights are measured at commercial airports and made available on coded weather observations. If you have an airport near you that measures cloud height you might be able to determine if the cloud base is in the low or middle level. If the height is lower than 6,000 feet it is a low cloud. If higher, it is a middle or high cloud.
But here is the problem. Cloud heights are only measured to 12,000 feet and middle clouds extend up to 18,000 feet. So above 12,000 feet you are on your own in estimated whether clouds are in the middle or high level. It is not an exact science. That’s where cloud appearance and experience comes in handy - along with a good cloud chart. Looking at the shape, size and texture of a cloud is very helpful for determining its height and type. The size of individual cloud elements helps determine the height. Low cumulus are larger than middle level cumulus which are larger than cirrus level cumulus. The size of cloud elements becomes a key in estimating height.
Clouds are placed in families based upon their height; high, middle, or low. There is a special cloud type, known as accessory clouds, but we won’t get into that now. Within cloud families are basic types; cirrus, cumulus, and stratus. Cirrus are high and wispy, cumulus are puffy, and stratus are layered. That part is easy.
Difficulties arise when clouds are near the artificial dividing heights between low, middle, and high clouds. The photos below illustrate the problem. Are the clouds middle or high clouds? The shape and texture tell us the type and what processes are creating the clouds. We make the best estimate we can.
So, looking at the photos below, are the clouds middle level or high? To put it another way are they in the cirrus (cirrocumulus) category or the middle cloud (altocumulus) category? I made some educated guesses based on the individual element sizes. I know for sure they are not low clouds because they look far away and the cloud elements are smaller than low clouds. Whether they are middle or high is subject to opinion. There are both stratus and cumulus types in a few of the photos. The other photos have only cumulus types.
This description is under construction.

Cirrocumulus and Cirrostratus.

Altocumulus

Altocumulus

Cirrocumulus, altocumulus, and altostratus

Cirrocumulus and altocumulus

Altocumulus
Cirrocumulus, Altocumulus and a low level cumulus fractus (foreground)

Cirrocumulus, altocumulus, and altostratus

Altocumulus

Altocumulus

Altocumulus

Cumulus floccus looking high north

Cumulus floccus looking high north

Distant altocumulus looking SSE

Cumulus floccus close-up with camera looking almost straight up


Fragments of forming cumulus floccus looking NNW
Cumulus floccus upper left corner with fragments of cumulus floccus forming right of center and bottom right
Copyright 2016-2024, Weather Briefing, L.C.
Cedar Falls, IA 50613, Phone: 319-215-2634, Email: craig@weatherbriefing.com