Monday, February 21, 2022 at 8:00 a.m. CST
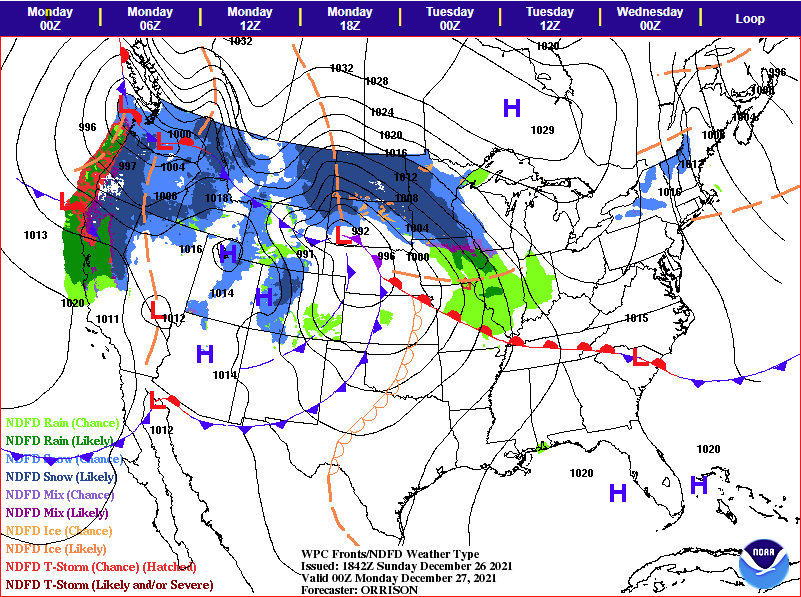
Commentary is coming later but for now here are two maps from this morning showing the storm we are watching. The first map includes only the station model plots. The second map shows the surface analysis with fronts and areas of high and low pressure superimposed. The first map gives you a clean look at the data. Read last evening’s post for instructions and then pick a few cities to follow and compare the observations from last evening to this morning.

The station model plot format is on our home page. Notice temperature, wind, and cloud cover How have they changed since last night? This is a large slowly developing system so the changes will be slow.

Maps plotted using Digital Atmosphere available at www.weathergraphics.com

Here is the same map with the fronts and pressure centers located. In general, we are looking at a very large mass of polar/arctic air sprawling south from Canada into the north central U.S. Warmer air is moving northward and overrunning the cold air. This will eventually lead to precipitation in the form of rain, drizzle, freezing rain and freezing drizzle and snow in the cold air. Pick a few cities and follow the weather changes as the storm develops.

Next let’s check a few cities and see what the Station Model Plot has to say about their weather.

Amarillo, Texas: 51 degrees, dew point 10 degrees. Wind from the southwest at 15 mph. Pressure is 1004.1 millibars (mb), sky is clear.

Des Moines, Iowa: 35 degrees, dew point 29 degrees, Wind from the east at 5 mph and the pressure is 1008.9 millibars.

Bismarck, North Dakota: -7 degrees, dew point -14 degrees, wind from the northeast at 15 mph, light snow, and overcast with IFR celing

Weather Arriving from all Directions

Air masses are coming together in the middle of the country. Follow the changes while practicing your decoding of station model plots of local weather. We will start with this weather map from Sunday evening, February 20, 2022, at 10:00 p.m. CST and update with later maps as the storm develops.

This is a very interesting map because the weather is very busy. Behind a cold front dropping south into the north central U.S., temperatures drop off quickly from the 50s over southern Iowa to below zero in southern Canada. Check the station model format on our home page and decode the temperatures. Watch for rain, freezing rain and snow to develop over the central U.S. during the next 24 to 48 hours. We will follow it here so you can practice your decoding skills while following a storm. Pick a few cities and follow their weather.

A broad area of low pressure is located over the Intermountain Region (Utah, Nevada) to the central Plains (Nebraska, Kansas). Southerly winds are blowing from the Gulf Coast north to Kansas and Nebraska and northeast to the lower Great Lakes. Notice the north and northeasterly winds over the Northern Plains (Montana to the Upper Great Lakes. There is a general counter-clockwise air motion over the central Rockies west to Utah as mild Pacific air spreads across that area and southerly winds move north from the Gulf. At the same time cold air is spreading southwestward toward the low pressure from the upper Great Lakes to the Northern Plains. This combination is the counter-clockwise flow spreading toward the area of low pressure in the central Rockies.

Map plotted using Digital Atmosphere available at www.weathergraphics.com

The dashed red lines are isotherms (lines of constant temperature). They are closest together in the cold air. In the warmer air temperatures increase to the mid 60s toward the Gulf coast. Each dashed red line (isotherm) represents a 2-degree F change in temperature. Isobars are the solid black lines of equal pressure. The wind speeds tend to be stronger where the isobars are close together and weaker where the isobars are farther apart.

You will need to know the station model format which can be found on our home page in order to decode the observations. Start by looking at the temperatures at different weather stations and also the wind and the air pressure readings. When you look at this map imagine that the air is coming together from all directions over the central Rockies. That is what is happening. More on this tomorrow.

Tracks of a Snowstorm!

Satellite imagery puts it all in perspective. Here is the GOES visible satellite image on Friday, February 18, 2022, at 12:01 CST. The images shows a large part of North America including Mexico and Central America, the United States, and southern Canada. While we see the clouds there is also a noticeable band of white from northern Oklahoma across southeast Kansas, Missouri, the southeast corner of Iowa, central and northern Illinois and on to the lower Great Lakes. This is the path of the last snowstorm - the track of the storm!

A closer view of the track below this image shows where trees and lakes, which are not snow covered, show up as darker areas. They are easily identified.

GOES image courtesy of NOAA/NESDIS/STAR

Notice the distinct band of snow cover from northern Oklahoma northeast to Indiana. Within the band we can see the location of rivers - especially in Illinois and Missouri. To the north there is a band of clouds from South Dakota and southern North Dakota across southern Minnesota into Wisconsin. Most of the white (not all) over northern Iowa is snow cover. Snow cover is also visible in northern Minnesota and if you look closely you will see distinctly denser areas of white in northern Minnesota that is ice and snow cover over the larger lakes in that area. The Upper and Lower Red Lakes are visible as is Leech Lake. Truly remarkable imagery!

Image courtesy of NOAA/NESDIS/STAR

Clouds of the Day - Wednesday, January 5, 2022

Sun Dogs on Display

We had sun dogs on display for most of the morning today. Very fine ice crystals formed when strong winds blew snow into the air pulverizing snow flakes into tiny ice crystals. The Sun is on the right side of this photo and a Sun Dog formed as an arc to the left when sunlight was bent (refracted) by the ice crystals. The blowing ice crystals and stratus clouds are seen in this photo (more on sun dogs later).

Clouds of the Day - Sunday, December 26, 2021

Altocumulus and Altostratus

A low pressure system is organizing over western South Dakota today. The forecast map below shows the expected position for fronts and precipitation at 6:00 p.m. this evening. Clouds have been overspreading Iowa today and ceilings are expected to continue to lower this afternoon. Three photos below show the mid-level cloud types that have been visible so far as the storm system expands upward motion eastward.

Forecast Map from NOAA/Weather Prediction Center valid 6:pm CST 12-26-2021

Wave Clouds - Altocumulus with altostratus above

Wave Clouds - Altocumulus with altostratus above

Left above - Upward air motion is causing water vapor to condense into mid-level clouds. Waves in the air flow are rippling through the cloud layer to form these wave clouds - altocumulus. Altostratus are visible above the altocumulus layer.

Right above is another view of the altocumulus looking to the southeast. The flow at the cloud level is from the northwest so this photo looks down stream with the flow. Altstratus is visible above the altocumulus.

The left photo above looks to the north and shows altocumulus lined up in rows from southwest to northeast and as individual cloud elements.

The right photo is looking west in the early afternoon and shows mostly altostratus clouds. However, there are still ripples of altocumulus waves apparent in the bottom and lower right corner. These photos show the broad scale of the upward motion and the mid-level clouds that have formed in the area of upward motion. The clouds cover northeast Iowa will continue to lower as moisture increases within the area of broad upward vertical motions. The expected sequence is for the altostratus to invade the entire sky followed by precipitation aloft obscuring the cloud ceiling. Once the precipitation reaches the ground the cloud will be named nimbostratus. The precipitation will be rain. The temperature as I post this text is 41 degrees how the precipitation will begin as rain and snow aloft, but the snow will melt before reaching the ground.

Clouds of the Day - Thursday, December 23, 2021

Summer Sky vs Winter Sky

Summer skies are dynamic - with exciting action. Winter skies are more placid. But don’t be fooled. Compare the photos below. The first one was taken in June of 2021. The second was taken today, December 23, 2021.

In June the sky was roiling with turbulence. Warm moist air was rising rapidly producing bulging clouds called cumulus congestus (large, congested cumulus) and cumulonimbus (thunderstorm). Today the clouds looked serene with a layer of altostratus (high stratus) and another layer of weak (almost flat) cumulus. Upward motions in cumulonimbus sometimes exceed 60 mph while altostratus form where air is rising a few inches per second. Thunderstorms are intense localized storms while altostratus or altocumulus form in vast cloud sheets covering many 10s or 100s of square miles.

The clouds shown below show the contrast between summer and winter skies.

Cumulus congestus and cumulonimbus in background.

Altostratus in background and altocumulus in the foreground. The Sun is visible through the clouds.

Clouds of the Day - Wednesday, December 22, 2021

CONTRAIL

CONTRAIL is short for CONdensation TRAIL. It is the condensation of moisture in the exhaust of jet engines. The first photo below also shows a small patch of cirrocumulus clouds, possibly created from a previous CONTRAIL. The second photo is a closer view of the CONTRAIL and the aircraft. It takes an eagle eye but if you look closely at the second photo you can see the aircraft located ahead of the condensation trail. Condensation occurs a short distance behind the aircraft when the hot gases of the exhaust have cooled to the condensation temperature of the water vapor.

CONTRAIL with cirrocumulus patch

CONTRAIL

Clouds of the Day - Tuesday, December 21, 2021

Cumulus

Cumulus is one of 10 principal cloud types. Its name refers to the puffy or heaped shape caused by upward motion as air warmer than the surrounding air rises. As it rises it expands because the surrounding air at higher levels is under less pressure. As it expands it cools and the invisible water vapor in the air condenses. The level where it condenses is called the condensation level.

The two photos below show cumulus clouds with different shapes and sizes in a group. The clouds were moving from the northwest to southeast in a cold air mass. The afternoon sunshine was warming the earth creating masses of warmer air rising to the condensation level where the moisture condensed into puffy clouds.

Cumulus

Cumulus

Clouds of the Day: Monday, December 20, 2021

Altocumulus: Today dawned with cirrus spreading overhead from the west. During the day, the cirrus was joined by a lower layer of altostratus. The first photo below shows wisps of cirrus mixed with thicker altostratus in the lower half and a sheet of darker altostratus in the upper half. The second photo shows thick altocumulus.

Altostratus

Altocumulus (cloud bases higher than 6,000 feet)

Surface temperatures warmed from the 20s into the mid-30s during the afternoon. Winds at the cloud level were blowing at 40 to 50 mph. By early afternoon the cirrus thickened with cloud bases dropping. By the time second photo was taken vertical tufts of altocumulus were visible. The clouds were still high, near the top of the level where middle clouds form and just below the cirrus level. The clouds in the second photo below are altocumulus. Look closely and you will see puffy clouds building out of the flat cloud bases - the telltale sign of cumulus.