
Weather Briefing Cloud Identification Chart
Click the image to learn more and purchase the chart.
The chart is printed on durable 100# gloss paper and fits in a standard 24” x 36” frame. It is shipped in a mailing tube without folding.

Learn about Weather Stations & Weather Observing
Click the photo below for the current 10-minute weather observation.
Click the photo below to learn about weather stations.


The observation site includes automated and manual weather instrumentation. Manually read thermometers are located inside the Medium Cotton Region Shelter and a manually read rain gauge is located on the post in the background of the left hand photo. The manual rain gauge collects snow which is melted to determine its water content. Automated instrumentation includes the rain gauge on the pole and the temperature, relative humidity, and air pressure in the aspirated housing in the foreground of the photo on the right. Dew point is computed from the temperature and relative humidity readings. Snow depth is measured by hand with a snow measuring stick. Rain and the water content of snow is reported to the CoCoRaHS Network daily.
Volunteer to be part of the CoCoRaHS Network
What is CoCoRaHS?
“Volunteers working together to measure precipitation across the nations.”
CoCoRaHS is an acronym for the Community Collaborative Rain, Hail and Snow Network. CoCoRaHS is a unique, non-profit, community-based network of volunteers of all ages and backgrounds working together to measure and map precipitation (rain, hail and snow). By using low-cost measurement tools, stressing training and education, and utilizing an interactive Web-site, the aim of CoCoRaHS is to provide the highest quality data for natural resource, education and research applications. CoCoRaHS is now in all fifty states and Canada.
Weather Blog

Posts covering a variety of weather-related topics are added periodically. Learn about the Clouds of the Day, meteorology, and weather features.
Weather Briefing Store

Our online store offers the Weather Briefing Cloud Identification Chart and Cloud Collection Note Cards. We also offer free digital products for download.
Cloud Atlas

The Weather Briefing on line Cloud Atlas includes images of cloud types recognized by the World Meteorological Organization. Use the atlas to identify clouds.
FREE CHARTS and FORMS
USA Weather Briefings
A collection of links to primarily United States Government websites with local weather forecasts, middle and long-range outlooks, climate data, weather observations, weather maps, USA and global weather forecast computer forecasts, and more.

https://www.weather.gov/
USA National Weather Service homepage for USA forecasts, watches, warnings, radar, satellite imagery, and all NWS services.

https://www.wpc.ncep.noaa.gov/national_forecast/natfcst.php
The Weather Prediction Center provides maps, winter weather, excessive rain outlooks, and archives for the USA.

https://www.spc.noaa.gov/
The Storm Prediction Center provides current severe weather watches, severe weather discussions, and severe weather and fire weather outlooks for 1 to 3 days and 4 to 8 days. It also provides storm reports.

https://www.nhc.noaa.gov/
Interested in hurricanes? Get public analyses, forecasts, data, tools, educational resources and archives about tropical storms including hurricanes here.

https://aviationweather.gov/
The AWC provides weather information for the world’s airspace. There are interactive maps, observations, pilot reports, terminal forecasts, SIGMETS and G-AIRMETS. As you might guess - there is more.

https://water.weather.gov/ahps/rfc/rfc.php
Link to USA River Forecast Centers for river observations and forecasts, weather observations and forecasts, water supply, climate and history, including local information.

https://www.cpc.ncep.noaa.gov/
The Climate Prediction Center homepage with extended two-week, monthly, and seasonal outlooks and much more climate information.

https://www.weather.gov/cys/unitedstatesroadconditions
USA Road Conditions and other travel alerts are available from each state. Choose your state of interest from a list of individual states.

https://www.star.nesdis.noaa.gov/GOES/index.php
Use the GOES Image viewer from NESDIS to access images from the GOES 16 and GOES 17 geostationary satellites.

Background radar Map Courtesy of NOAA
The USA National Weather Service network of doppler radars provides national radar coverage for operations and severe storm warnings.

University of Utah Department of Atmospheric Sciences Weather Center with computer forecast models and current observations.

https://www.weather.gov/safety/

https://www.emc.ncep.noaa.gov/emc/pages/ncep-numerical-forecast-systems.php
Provides access to NOAA Weather forecast models.

https://droughtmonitor.unl.edu/CurrentMap.aspx
Collection of Links to Weather Related Information Sources and More…
Links to Satellite - Radar - and Graphical Forecasts
Station Model Tutorial
Learn to decode the station model plots on surface weather maps.
The volume of weather data coming from weather observations, radar, satellites, weather balloons, ships, aircraft, is massive. The data is gathered, decoded, sorted, plotted on maps, analyzed by hand and computer programs, and used in computer models to assist meteorologists in weather forecasting. Hourly weather observations from weather stations across the globe are plotted on surface weather maps using a standard station model format. Learning how to read the station model format will make it possible for you to decode weather observations from around the world.
I learned to decode station models plots using daily weather maps mailed to my home from the U.S. Weather Bureau in the 1960s. I went on to become a meteorologist and have been forecasting in a variety of assignments for more than 40 years. I enjoy looking at weather maps and decoding the weather from far-away places, places I may never visit but for a moment in time have my attention because of the weather. Weather can be a profession, it can be a hobby, and sometimes it is both.
Use the tutorial here to decode station model plots. Plotted maps are available free online, or Digital Atmosphere software may be purchased from www.weathergraphics.com to make maps like the sample below. The data plotted was available free on the internet.


Click this image and then scroll down to see plotting symbols. Data was plotted on this map using Digital Atmosphere software available at www.weathergraphics.com.
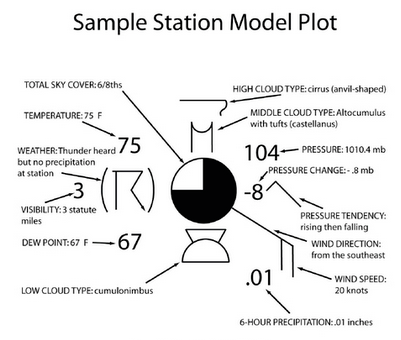
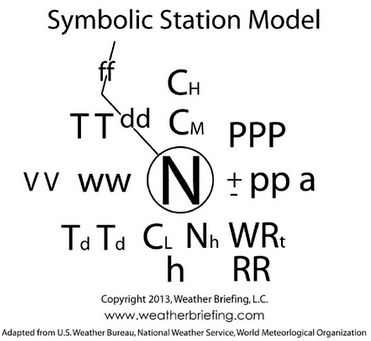
Sample and Symbolic forms of the Station Model Plot
Here are two illustrations of the Station Model Plot format. The left version shows a station model plot with an explanation of each element. The version on the right shows the plot in a symbolic format. Look at the left version carefully to see how the data is arranged around the station. Weather stations are represented on maps by a circle or a square. The circle indicates the observation is augmented by human observation. The squares indicate the data is taken from an automated weather station without human input. The samples below show all possible data that could be plotted. With practice it is usually easy to figure out what data is being plotted.
In the United States surface temperatures at the Earth’s surface are plotted in degrees Fahrenheit, pressure in millibars, precipitation in inches, and wind in knots (nautical miles per hour). Other nations use degrees Celsius, millibars, and wind in meters per second or knots. When interpreting a station model plot, it is necessary to know what units of measurement are being used. All plots of upper air data use the metric system except for wind, which is plotted in knots. You will occasionally find wind plotted in meters-per-second.
Sources of Plotted Maps & Data
The following buttons take you to plotted weather maps. The maps are free. In most cases the station plots do not include all data reported by each station. The only way to view the entire observation is by reading the coded text observation. However, it is possible to figure out what IS plotted by comparing the map plot with the complete plots shown above. The most commonly plotted elements include temperature, dew point, pressure, wind direction and speed, and cloud cover. Note: Canadian weather maps plot temperatures and dew points in degrees C.
The Aviation Weather Center has plotted maps and raw METAR observations in coded and decoded formats. Click HERE.
The Unified Surface Analysis is produced by the National Centers for Environmental Prediction (NCEP), Weather Prediction Center (WPC), Ocean Prediction Center (OPC), National Hurricane Center (NHC), and the Honolulu Forecast Office (HFO). The maps include abbreviated station model plots. Use any of the links above to practice decoding station model plots. None of the station plots include all possible parameters measured by the weather stations. This is done to save space or simplify the plot. To plot all data available from the weather stations use the Digital Atmosphere software that is described below. When using the plotted maps above it is usually easy to figure out what data is being plotted.
Weather Data Plotting Software
To plot your own maps I recommend Digital Atmosphere software available at www.weathergraphics.com. It downloads, plots, and analyzes current and past observations worldwide using freely available data. Try it out for free. Many of the maps you see in my WxBlog are plotted by Digital Atmosphere.
NOTE: Many nations use metric units when plotting surface data. Digital Atmosphere allows users to specify whether to plot temperatures in F or C.
Sample Station Model Plots - Practice Makes Perfect
Practice your station model plotting and decoding skills using the map below or use real-time plots by clicking the buttons above. The map below has station model plots at 5:00 p.m. CST on December 20, 2021. Use the Station Model Tutorial as a reference. Temperatures are plotted in degrees Fahrenheit, wind in knots, cloud ceilings in hundreds of feet, precipitation in inches, visibility in miles, and pressure in millibars. Stations reporting clouds may also report cloud ceilings. A ceiling is the height of the cloud base layer. For example:
Rapid City, South Dakota reported a cloud ceiling of “C14,” which is a cloud base at 1400 feet. The 14 is in hundreds of feet so adding two zeros after the 14 gives the height of the cloud base.
Minneapolis, Minnesota reported an air temperature = 14 degrees Fahrenheit (F), dew point = 1 degree F, barometric pressure = 1025.9 millibars, wind from the northwest = 10 knots, and 25% cloud cover. See the NOTE below to decode the pressure in milibars.
The Chicago, Illinois temperature = 39, dew point = 27, barometric pressure = 1020.0 millibars, cloud cover = 75%, lowest cloud ceiling = 25,000 feet, and wind from the west at 10 knots.
Glasgow, in the northeast corner of Montana reports: temperature = 12, visibility 3/4ths of a mile in light snow, dew point = 7, barometric pressure = 1018.2 millibars, the sky is obscured due to light snow, the ceiling is “C19” which is 1,900 feet, and the wind is from the east at 15 knots.
Winnipeg, Manitoba Canada reports: temperature = 1, dew point = -11, barometric pressure 1024.7 millibars, the sky condition is missing, the pressure tendency was rising and is now falling, dropping .5 millibars in the past 3 hours, and the wind is from the west at 5 knots.
NOTE: Barometric pressure on a surface map is reduced to sea level. It will always be near 1000 millibars and is always coded using three digits. If the 3-digit code begins with a 9, place another 9 at the beginning. Example: a reading of 986 would be changed to 998.6 millibars. The pressure is always displayed with one decimal place. If the leading number is not 9, place 10 at the beginning. For example: if the reading is 133, change the number to 1013.3 millibars.
This map below is plotted using Digital Atmosphere software. Learn more and trial the software at www.weathergraphics.com. There are many websites that provide plotted maps for free. Some of the sites are linked to from the buttons above.
NOTE: Our Station Model Tutorial shows all possible plotted parameters. Operational plots may not include all available observation data. In most cases, you will be able to figure out what data is missing by comparing plotted data to the sample/symbolic. The map below is an operational plot using Digital Atmosphere. Any missing data is either not being observed or the software is set to not plot it. Weather stations where weather is more active will often plot more data than stations in areas where weather is fair. NOTE: Digital Atmosphere allows you to automatically have temperatures plotted in Fahrenheit or Celsius.

A Source of Real-Time Station Model Plots
The Storm Prediction Center provides hourly plots of surface weather reports. Click the map below to access those plots. Choose your region of interest and under “Observations” you will find “Surface Data”. Other data is available, including computer forecasts of severe weather parameters used by meteorologists. That data requires professional training to utilize it. Click the map below to plot the latest station models.

Regional Surface Station Model Plot Sample
Link to the World of Weather & Climate - and more!
A collection of links from weather, astronomy, NASA, and other sources.

The following links provide worldwide weather information from a variety NOAA/NWS, international, and other weather sources. The information ranges from public forecasts and discussions to technical data used by professionals. Learn more about what is behind your daily weather forecast by browsing the categories. If you are interested in weather, there is probably something in here for you. This collection includes links to the USA governmental sources that were listed above. Be sure to scroll all the way to the bottom - you may find a few surprises.
Categories of Links
These categories are updated regularly with new links.
Weather Visualization
Using Weather Forecasts
National and International Weather Portals
Observations/Maps - USA and North America
Computer Forecast Models
Observations and Remote Sensing
Forecast Centers
Forecasts - Maps, Text, Graphical
Climate Products and Data
Historical Weather and Climate
Instrumentation
The Sun
Education and News
CoCoRaHS
Many links within a category lead to other weather information sources. For example, the weather portals point to maps, data, forecasts, imagery, and other information. Just dig around a little to learn more.
The links are provided for educational purposes. Weather Briefing L.C. is not responsible for the content provided by other websites and makes no guarantee regarding the timeliness, usefulness, or accuracy of the data. Users are solely responsible for how the information is used.
Weather Visualization
Using Weather Forecasts
Weather Portals:
United States & International
These websites will lead you to forecasts and all other public information made freely available by these meteorological centers.

Environment Canada

United States National Weather Service

World Meteorological Organization

Australian Bureau of Meteorology
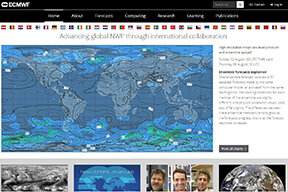
European Centre for Medium-Range Forecasting

Japan Meteorological Agency

Brazilia Met Office
United Kingdom Met Office
U.S.A. Forecast Centers

Baltimore/Washington Forecast Office - NOAA Photo
These links go to specialized weather forecast centers in the United States. These centers provide professional forecast support to National Weather Service Forecast Offices and make discussions, maps, and data available to the public. National Weather Service Forecast Offices provide public forecasts to the United States. Direct links to those offices are found in the Weather Portals section above.

Aviation Weather Center

River Forecast Centers

Weather Prediction Center

National Hurricane Center

Storm Prediction Center

Weather Prediction Center

Winter Weather Forecasts

Climate Prediction Center

Fire Weather
Forecasts - Maps, Text, & Graphical Products
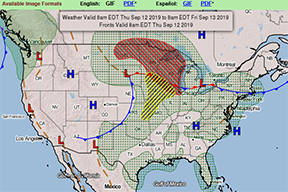
Forecast Maps
This section includes links to maps and discussions for short and medium term forecasts and outlooks.
Computer Forecast Models
These buttons link to weather forecast computer models. Models are used as the basis for weather forecasts. The NOAA makes portions of United States model output freely available to the public on the internet. Private weather consulting companies access fee-based government data, including observations, radar, satellite and model output, to provide specialized forecasts in the private sector. Freely available information is available on U.S. National Weather Service, other U.S. government websites, and various university websites. The European Center releases limited model maps and information free but charges a fee to access most of the data used by professionals. All governmental and private computing centers have internal products not accessible by the public. Software packages and subscription services are available through private companies. The data, imagery, and model output available on this website is freely available from NOAA on the internet at no charge. Software packages recommended on this website are for your information. Weather Briefing does not receive funding for any recommendations.
Observations/Maps:
USA - Northern Hemisphere
Look at plotted maps and animations in this section. There is also a link to current USA road conditions and also a link to USA drought conditions. The three hourly North American Surface Map includes an abbreviated version of the station model plot using stations across North America.


Remote Sensing - Radar, Satellite, Upper Air, Raw Data

GOES Remote Sensing
Data
Radar
Satellite
Climate Products & Data
Long term outlooks, information, and expected impacts in the near term (12 month) climate outlooks.
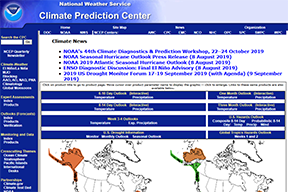
Climate Prediction & Data

observations & Trends

Short and Long TeleConnections
The costliest Severe Thunderstorm Event
in United States History.
August 10, 2020
Climate Reference Network
“The vision of the USCRN program is to maintain a sustainable high-quality climate observation network that 50 years from now can with the highest degree of confidence answer the question: How has the climate of the Nation changed over the past 50 years?” - NOAA, National Centers for Environmental Information
Publications
Historical Weather/Climate
Don’t miss these videos for an eye-opening perspective on past changes in Earth’s climate.
Instrumentation
Learn about weather instrumentation and exposure standards.
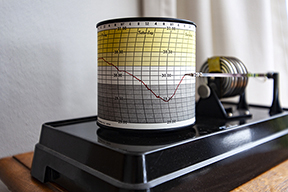
Barograph

Cotton Region Shelter

Thermometers inside a Cotton Region Shelter
Weather Briefing Weather Stations
Cedar Falls, Iowa
Learn about weather instrumentation and get the latest observation from an automated weather station.
NOTE: The automated rain gauge does not measure snow or the water content of snow.
Click on any of the images or the buttons below to see the latest observation.

Siphon Tipping Bucket Rain Gauge, WMO Standard

Temperature, Relative Humidity, Pressure, Dew Point Measurement and aspirator Fan

Wind Direction & Speed (Vane and 3-Cup anemometer)
Weather Briefing maintains two weather stations in Cedar Falls, Iowa. One station uses a standard Medium Cotton Region Shelter which houses standard meteorological thermometers that measure maximum, minimum, and the current temperature. These readings must be taken manually.
The other station is automatic. It records temperature, dew point, relative humidity, barometric pressure, rain, wind direction and speed, and solar radiation. Observations are updated continuously on site and every 10 minutes on the internet. Click the left button below to see the latest observation. It includes the current observation and meteographs which trace the last 2 days and 7 days. Click the right-hand button to link to the Weather Station web page to learn about the weather stations, the sensors, the accuracy, and how instruments are exposed. Note: If you have a VPN turned on the data may not update.
Click the button above to see the latest weather observation.
Learn about weather stations by clicking the button above.
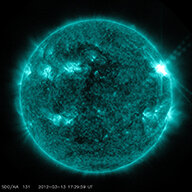
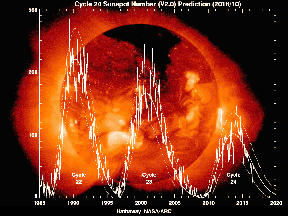
The Sun

The LiveCam will show northern lights at Churchill during the night.
EDUCATION
Scientific Presentations
Miscellaneous Links

Click this image to learn about snow at http://snowcrystals.com/
NASA & Space Science
Photo from Perseverance is courtesy of NASA
Zoom by rolling the mouse wheel.
Mars Weather & Climate and more…
Video courtesy of Encyclopedia Britannica
Video courtesy of Encyclopedia Britannica
As the Sun sets watch Comet Neowise appear. Courtesy of Dr. Roy Spencer.
General Science & Education
Coordinated Universal Time - Time Zones - 24 Hour Clocks
Weather is global. The free exchange of weather data between most countries requires using a time standard that does not change - the time must be the same everywhere and it must not include daylight saving time. Today we use UTC, also known as Coordinated Universal Time. All nations coordinate their weather data gathering schedules using the same clock. While local times are different, world time is the same everywhere. Learn about time and UTC by clicking below.
Be part of CoCoRaHS
“Volunteers working together to measure precipitation across the nations.”