Mammatus at Sunrise

Mammatus Photo by Craig Johnson taken at Cedar Falls, Iowa

Mammatus Photo by Craig Johnson taken at Cedar Falls, Iowa

This dramatic sunrise is looking east from Cedar Falls, Iowa. Bright yellow light from the setting Sun is illuminating a large field of mammatus clouds. Mammatus form under the anvil of a thunderstorms as air flowing out of the top of the storm is directed downward forming "pockets." Photo taken by Craig Johnson looking east from Cedar Falls, Iowa.

Altocumulus in Formation

Altocumulus forming in bands. The different cloud shapes are caused by differences in the air motions forming each band. Photo by Craig Johnson at Cedar Falls, Iowa.

Altocumulus forming in bands. The different cloud shapes are caused by differences in the air motions forming each band. Photo by Craig Johnson at Cedar Falls, Iowa.

This unusual formation features two bands of altocumulus a ribbon of blue sky with median of scattered altocumulus. The three parallel bands exhibit different cloud processes. On the left is altocumulus stratiformis undulatus. This cloud type displays an undulating flow of ripples in the flow. Note that there appear to be ripples moving left to right at a 90 degree angle to the main flow which is from the bottom to top of the photo. On the far right are altocumulus stratiformis which exhibit more of a cellular pattern of smaller cloud patches surrounded by small clear areas. This indicates different processes are involved in the formation of these two bands In the middle are altocumulus that look like a combination of cellular cloud patches but with an undulating pattern. Generally areas that are clear are regions of sinking air and or air that is not saturated or both.  

Cotton Region Shelter

Cotton Region Shelter - Photo by Craig Johnson

Cotton Region Shelter - Photo by Craig Johnson

The Cotton Region Shelter is an American adaptation of the original Stevenson Screen which was developed by Thomas Stevenson in 1864. Stevenson was a civil engineer and, incidentally, the father of author Robert Louis Stevenson. Stevenson's small screen (shelter) was modified by Edward Mawley  and adapted by the Royal Meteorological Society in 1884. Stevenson's design included double louvered sides all around.

The American adaptation, called the Cotton Region Shelter, houses thermometers (standard as well as maximum and minimum), a psychrometer or other device to read dew point and relative humidity, and recording thermometers, hygrometers and barometers. The purpose of the shelter is to shield the instrumentation from direct sunlight and precipitation, while allowing a free flow of air. If sunlight shines directly on the sensors the readings will be too high. 

Interior of Cotton Region Shelter - Photo by Craig Johnson

Interior of Cotton Region Shelter - Photo by Craig Johnson

The shelter pictured above meets official National Weather Service standards. Inside are the following instruments; left to right:

  • Transmitter and sensors for remote display of temperature and relative humidity (far left)
  • standard mercury in glass thermometer
  • maximum - minimum thermometers on a Townsend Support
  • a hygrometer
  • sling psychrometer to measure wet-bulb temperature and determine relative humidity and dew point (far right)
  • On the floor of the shelter near the sling psychrometer is a jar with water for the sling psychrometer

The shelter is used for hobby purposes. The standard thermometer and max-min thermometers and sling psychrometer are scientific grade instruments. The dial hygrometer (right corner) and the transmitter and sensors (far left) are consumer grade accuracy. Records are kept using the scientific grade instruments. The front door to the shelter faces north and is opened only when the instruments need to be read. Notice the instruments are kept in the shade by the shelter.

The Cotton Region Shelter has been largely replaced for official measurements in the United States by the MMTS (maximum-minimum temperature system) system. The MMTS began replacing cotton region shelters in the 1980s to eliminate liquid-in-glass thermometers that contained mercury. They were more convenient because readings could be read and reset indoors and the aspirated (ventilated by a fan) shelters with MMTS were more accurate. Today the Cotton Region Shelter is still used by many cooperative NWS weather stations and and still may be purchased. Prior to the 1980s the Cotton Region Shelters were the standard shelters in the United States. 

MMTS Shelter - Photo Courtesy of NOAA

MMTS Shelter - Photo Courtesy of NOAA

The MMTS shelter is aspirated which means air is pulled through the shelter by a ventilation system. This improves the accuracy of the readings. Large objects such as trees, tall bushes, buildings interrupt the flow of air around shelters and can affect the readings of both MMTS and Cotton Region Shelters. 

Minimum Thermometer inside a Cotton Region Shelter - Photo by Craig Johnson

Minimum Thermometer inside a Cotton Region Shelter - Photo by Craig Johnson

The close-up photo above shows the alcohol filled minimum liquid-in-glass thermometer. The black index marks the low point of the temperature since the last reset. The low temperature is read at the right end of the index. The thermometer is reset by tipping the thermometer clockwise allowing the index to slide down to the top of the alcohol. Surface tension of the alcohol stops the sliding index at the current temperature. As the temperature increases the alcohol flows around the index as it expands to the right leaving the index in place where it was reset. When the temperature decreases the alcohol contracts to the left. When it contacts the right end of the index the alcohol drags the index to the left. The alcohol can drag the index to the left but it cannot move the index to the right as the alcohol expands.

Cumulonimbus

Weather Briefing Video

Lightning flashed and thunder rumbled as a strong thunderstorm moved across Black Hawk County, Iowa. The downpour dropped about an inch of rain in 30 minutes with street flooding reported in some areas. At my location the storm was not severe - winds were light, there was no hail, and the rain intensity ranged from moderate to heavy. As the storm moved southeast high winds and hail were reported with numerous severe thunderstorm warnings being issued.

Approaching Thunderstorm

Weather Briefing Video

There is a lot of action along the leading edge of a thunderstorm. Air is flowing into an out of the storm creating many different cloud structures. It's a place of sudden temperature drops with the potential for strong winds as cold air aloft descends to the surface. This storm turned out to be a typical Iowa summer thunderstorm when it crossed Black Hawk County, Iowa. In this case the winds were light at the surface while clouds aloft rushed to the southeast. This video shows cloud formations along the front of the storm and you will see lightning flashes followed by thunder. There was no severe weather here but we did receive about an inch of rain in about 30 minutes.

Ring of Fire

500 millibar Chart from NOAA

500 millibar Chart from NOAA

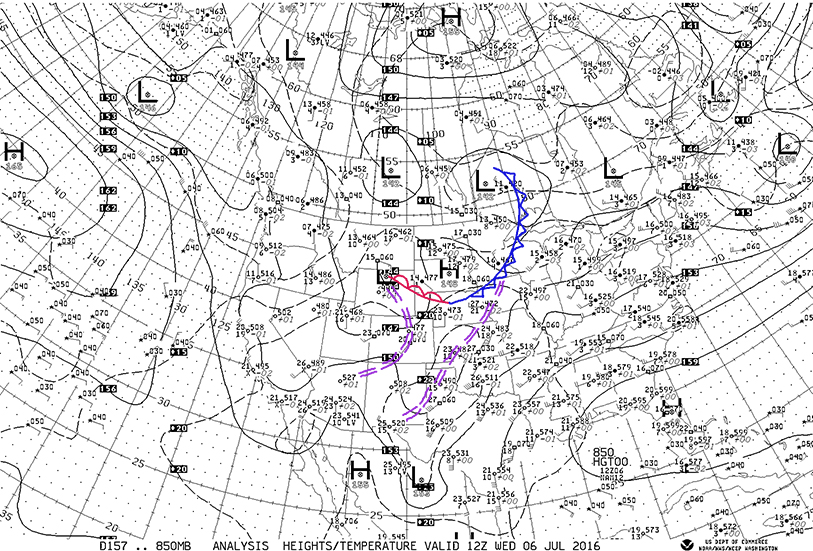
This upper air chart shows the flow, temperature, dew point depression, 500 mb heights, and centers of high and low pressure, aloft at approximately 18,000 feet. It is approximate because this map shows the height above sea level of the 500 millibar pressure surface...how high above sea level is the 500 millibar pressure surface located. The height is determined by radiosondes - balloons launched at 7:00 p.m. CDT this evening. One of the instruments on the payload package is a barometer - a device that measures air pressure. The air pressure is transmitted back to a ground station along with other data measured by the instruments.

The thin solid dark lines are drawn along lines of equal pressure - 500 millibars. Each line is either 60 meters higher or lower than the next line. Generally speaking the lines in the north are at a lower altitude than ines to the south - changing by 60 meters higher or lower from an adjacent line. 

The closer the lines are together the stronger the winds are at this level. For example the winds aloft, at 500 millibars, are stronger in the northwest corner of the United States than winds over the southern half of the U.S. (There are no lines over the southern U.S., while the lines are close together over the northwestern U.S. One thing we can infer from a map like this is the the flow aloft over the northern U.S. is stronger than over the south with the strongest winds in the U.S. at this height are over the northwest. 

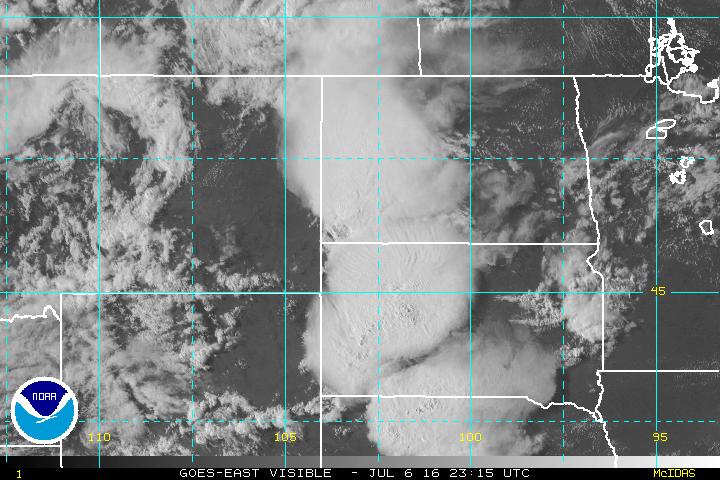
Disturbances in the flow will travel generally west to east across the northern U.S. this week. There is plenty of moisture and warm air blanketing the southern U.S. east of the Rockies and this air will move northward in advance of every disturbance. This means we can expect scattered thunderstorms with most of these disturbances.

This situation is sometimes called the Ring of Fire because a "ring" of thunderstorms develops in the flow on the north side of warm air aloft. If the air aloft is too warm it suppresses thunderstorm development. Cool air aloft associated with the disturbances in the northern flow will help make the air unstable and trigger thunderstorms. The storms create the so-called "Ring of Fire." Watch for thunderstorms this week to form in this flow over the northern United States. 

When is Science Really Science?

When scientists review the work of other scientists, part of the process involves evaluating the methods used to gather the data and draw conclusions. When it is done as part of a formal review process it's called peer-review. This video describes a process to gather data and draw conclusions about global temperature change. How data is manipulated directly affects the outcome of the research. This presentation is a must see for students of science. Is the data being gathered and used in a scientific manner? Why or why not? 

Anti-solar Rays

pHOTO BY cRAIG jOHNSON

pHOTO BY cRAIG jOHNSON

These are anti-solar rays. They are occasionally/rarely visible in the sky opposite the Sun. The Sun must be low in the sky - less than 20 degrees above the horizon. The alternating dark and light bands are caused by shadows from clouds. Dark bands are shadows, the light bands are sunlight scattered by dust and water vapor in the atmosphere. Without the shadows there would be no banding, just the typical uniform scattering of light normally visible in the sky.

The photo above was taken near sunset and is looking east near Cedar Falls, Iowa. The setting Sun is behind the photographer. Notice how the bands appear to converge to a single point. This is an illusion. The rays are actually parallel. The same illusion is seen when looking into the distance along a railroad track or highway. The rails or roadway appear to converge to a point. The next time you watch a sunset - turn around. You might see anti-solar rays behind you. 

Incubating Thunderstorm

This video is looking up into thunderstorms forming over Black Hawk County, Iowa on Saturday afternoon, July 23, 2016. Numerous small cells were congealing into a thunderstorm complex on a very warm and humid afternoon. This is the beginning of what turned into a severe thunderstorm complex that moved eastward to the Dubuque, Iowa area into northern Illinois. Cumulus clouds grew into cumulus congestus and cumulonimbus during a 45 minute period. Only a few brief downpours occurred here but nearly continuous thunder was heard to the east and southeast. The National Weather Service issued numerous severe weather warnings from Waterloo east along and near Highway 20 through the Dubuque area.

Thunder on the Plains

Three areas of thunderstorms developed this afternoon over eastern Montana, eastern Wyoming, and eastern Colorado. As of 6:45 p.m. CDT the storms extended from western North Dakota to western Nebraska and are moving eastward. Tornado and Severe Thunderstorm Watches are strung out along the entire length of the thunderstorm clusters along with numerous Severe Thunderstorm and Tornado Warnings.

The storm clusters are visible on this GOES visible satellite imagery at 6:15 p.m., July 6, 2016. The storm tops are visible as dense circular cloud masses. The storms will continue moving eastward and will likely merge into a large thunderstorm complex with its core over South Dakota and northern Nebraska. The storms should move east before turning slightly southeast over northern into central Iowa overnight. Other storms should continue across much of Minnesota. Damaging winds, hail, and heavy rain will be likely with the main storm complex and tornadoes are also possible as the cells organize before the system evolves into a more outflow dominated system as it crosses central and eastern portions of Iowa. Small leading edge tornadoes could occur as the system moves east-southeast. For the lasted forecast check the National Weather Service at www.weather.gov and the Storm Prediction Center and your local news media. This site isproviding a general discussion about the storms but not regular updates.

Midwest Thunderstorms

After a night of thunderstorms in parts of the Midwest more storms are expected today and tonight. The map below shows the upper air flow this morning at 7:00 CDT, Wednesday, July 6, 2016 at 850 millibars (850 mb) which is at about 5000 feet. The map is analyzed for fronts and troughs in the Midwest. An upper cold front (blue) was located from western Ontario through northwestern Wisconsin, southeast Minnesota, northwest Iowa to an upper warm front (red) from western Nebraska into northeastern Wyoming. Upper troughs are located from northcentral Iowa to southeast New Mexico and from Wyoming to Colorado, to northwest Arizona.

There is a general southwest flow of air from western Texas to the Great Lakes and Ohio Valley. A northwest flow is located behind the upper cold front. A southerly flow is getting re-established from western Kansas/Nebraska to the boundary across northern Nebraska, to southeastern Montana. This southerly flow is relatively dry over Nebraska, Colorado, and most of Kansas which will inhibit but not eliminate thunderstorm development this afternoon over the Central Plains. Look for scattered storms to form in the western High Plains as moisture gradually increase.


An interesting feature of the air mass over the Central Midwest is the lack of wide spread deep moisture over the Plains. The upper air sounding from Omaha this morning illustrates the issue. The dashed green line is the dew point while the red line is temperature. On the chart temperature increases to the right and altitude increases upward. Notice how the green line jumps to the left near the bottom - that indicates dry air just off the surface through 10,000 feet.

Notice the northeast winds at the surface (see the right vertical bar) which switch to westerly at about 5000 feet and increase with height. The wide separation of the green and red lines are regions of the driest air.

As southerly flow increases from Kansas to South Dakota pockets of moist air will likely help develop thunderstorms over South Dakota and Wyoming later today and tonight. Thunderstorms should develop north of the boundary that now extends from Wyoming (warm front aloft) to Nebraska (cold front) and move east or southeastward. Increasing moisture over Iowa should allow the storms to grow as they move east or southeastward toward Minnesota and Iowa. 

The upper air flow at about 18,000 feet (500 millibars) is shown below. Notice the increasing winds generally from west to east over the northern U.S. and the vigorous low pressure moving through the Pacific Northwest. This is an area of colder air aloft that will spread eastward and destabilize the air over the Upper Midwest Thursday. Look for a major outbreak of severe weather over Iowa as this system moves eastward. For more information on your forecast go to www.weather.gov and also the Storm Prediction Center websites.

Notice the temperatures at 18,000 feet. Davenport, Iowa is -8 degrees centigrade while Great Falls, Montana is -16 centigrade. The strongerflow that will develop at all levels tonight and Thursday will help generate severe thunderstorms across the Upper Midwest starting late this afternoon in southeast Montana, northeast Wyoming, and western South Dakota. The storms should move to the east and southeast with damaging winds and hail and possibly locally heavy rains although the forward motion should somewhat limit flooding except in places where the ground is already soaked. More on this later.

The lightning flash captured here happened during a May 20 storm not far from the Florida Tech campus in Melbourne. It was recorded at 7,000 frames per second using a high-speed camera.

Video courtesy of the Geospace Physics Laboratory, Department of Physics and Space Sciences, Florida Institute of Technology.

The Principal Investigator is Ningyu Liu from the Geospace Physics Laboratory in Florida Tech’s Department of Physics and Space Sciences

CONTRAILS (Condensation Trails)

Photo Courtesy of the NASA Langley Research Center

Photo Courtesy of the NASA Langley Research Center

This is an interesting photo from NASA Langley Research Center. It shows condensation trails (contrails for short) over the southeastern United States. These line shaped clouds form from the condensation of water vapor in the exhaust of high flying jet aircraft. Temperatures are extremely cold at the cruising altitudes of commercial aircraft so the contrails are made primarily of ice crystals.

Upper Air Sounding (Radiosonde) from Omaha, Nebraska

Plot of a Radiosonde launched at Omaha, Nebraska this evening (7:00 p.m. CDT on June 20th). The program used to plot the data is Raob.

Plot of a Radiosonde launched at Omaha, Nebraska this evening (7:00 p.m. CDT on June 20th). The program used to plot the data is Raob.

Above is the upper air sounding from Omaha, Nebraska this evening (7:00 p.m. CDT, June 20th). While a great deal of information can be obtained from an upper air sounding we will focus on three things this evening. Over time I will point out other features. Down the right hand side is the altitude scale with thousands of feet on the right side of the scale. The wind barbs are also plotted vertically to the right. Winds are from the north and northeast up to about 5,000 feet. Above the winds are from the west and northwest. The red line is the temperature and the dashed green line is the dew point, both plotted vertically. At the time of the sounding Omaha reported temperatures in the upper 60s at the surface due to rain cooled air covering the area. Outside of the rain area temperatures were in the 90s (not shown here).

Notice how the red line is shifted left (cooler) near the bottom of the chart but quickly warms above the surface. This marks a low level inversion (region of cooler temperatures below warmer air aloft. The normal pattern of air being cooler with height is "inverted" due to cooling caused by evaporation of falling rain at the surface. The wind at the surface is from the north and northeast out of thunderstorms that were moving just to the north and northeast of Omaha. The outflow from these storms was moving to the west and south covering Omaha with a layer of cooler air. Above the cooler air the wind is from the west and is increasing speed with height.

To learn more about reading the feathers and arrows used to plot the winds refer to the home page of this website. Examples and an explanation are available at no cost.

Thunderstorm Threat Growing

The threat of thunderstorms with heavy rain and severe weather is growing for the middle of the U.S. As mentioned here on Saturday (June 18th) a large dome of warm air aloft and the main upper level flow steering around it is expected to flatten early this week and allow thunderstorms to return to the Upper Midwest. This afternoon temperatures have been in the 90s over most of Kansas with readings reaching at least 100 at Salina and Manhattan. These storms are occurring near a boundary between the hot air occupying the Desert Southwest and Southern Plains with cooler air to the northeast. As the flow aloft is pushed to the northeast once again more storms are expected along the nose of the hot air from the Dakotas, Nebraska, Minnesota, Iowa, and Missouri along with parts of Wisconsin and Illinois. As the pattern shifts northeast Tuesday and Wednesday the storm cells will likely move from northwest to southeast being fed by a southerly flow at the surface bringing moisture north underneath a west to northwest flow aloft. Storms in this scenario favor the afternoon through nighttime hours before ending after daylight.

Below are satellite and radar images from late this afternoon showing storm clusters in Iowa and Missouri.

Radar Image from the National Weather Service at 7:18 p.m. CDT, 20 June 2016

Radar Image from the National Weather Service at 7:18 p.m. CDT, 20 June 2016

Strong thunderstorms are shown on this satellite image in northern Missouri and also over Indiana. Smaller cells are in southern Nebraska.  Thunderstorms are also indicated over southwest Iowa. More of the same is expected the next few days as the pattern shifts to the northeast. Check your local forecast for details.

GOES Visible Satellite Image at 6:45 CDT

GOES Visible Satellite Image at 6:45 CDT

A Tussle Aloft

500 Millibar heights in decimeters. Forecast for 7:00 a.m., Wednesday, June 22, 2016. High pressure ridge is pronounced from Eastern Colorado north over the Dakotas into Canada. The strongest flow of the Westerlies ranging from 40 to about 60 mph ex…

500 Millibar heights in decimeters. Forecast for 7:00 a.m., Wednesday, June 22, 2016. High pressure ridge is pronounced from Eastern Colorado north over the Dakotas into Canada. The strongest flow of the Westerlies ranging from 40 to about 60 mph extends from Northern California to Montana, the ND-SD border to Northern Illinois and Virginia then off the New England coast.

There is a tussle underway between a large high pressure ridge dominating the area from the Desert Southwest to the Midwest and core of the Westerlies aloft from the Pacific Northwest to the Northern Midwest. The ridge is a mound of warm air at the surface and aloft which is in the area south of the 588 line on the forecast 500 millibar map for Wednesday, June 22nd at 7:00 a.m. CDT. Temperatures in the 80s and 90s are common under the ridge with readings topping 100 in the Desert Southwest. The main flow aloft at about 18,000 feet (500 millibars) is being steered around the northern edge of the ridge.

During the next few days we should see a northwest flow of air aloft increase over the Upper Midwest. This pattern is favorable for showers and thunderstorms, especially from late afternoon overnight into the morning. The nighttime component of these storms is a major rain producer for the Midwest. Watch for this pattern to develop and for thunderstorms to become more numerous from the Dakotas southeastward through parts of Minnesota, Nebraska, Iowa, Illinois, Missouri, northeastern Kansas, to the east from Monday into Thursday. Locally heavy rain, large hail, strong winds and tornadoes are possible in this situation. Other isolated thunderstorms may form at random under the warm high pressure area.


Summer Heat

500 MB Chart, 7:00 a.m. CDT, 18 June 2016, from NOAA

500 MB Chart, 7:00 a.m. CDT, 18 June 2016, from NOAA

A large area of high pressure aloft extends from the Desert Southwest into the middle of the United States this morning. This high pressure aloft (at the 500 millibar level, approximately 18,000 feet) has been responsible for the hot dry weather in the Southwest with readings in the 90s and 80s over the Plains and much of the central and eastern U.S. The hottest weather is occurring under the high pressure center over Arizona, New Mexico northeast to the Central and Southern High Plains. A few thunderstorm clusters, typical of this type of summer pattern, formed in Minnesota, South Dakota, Nebraska, and Kansas. The strongest flow aloft has been forced around the warm air aloft from Northern California into southern and eastern Canada. Scattered thunderstorms are possible today around the northwest and northern edge of the high pressure and also over the Plains. Check your local forecast for details. Cooler temperatures are in the Pacific Northwest and the Great Lakes to New England.

The visible satellite image below from the National Weather Service at 11:15 a.m. CDT shows the remnants of thunderstorms that occurred over the Plains last night and early today. The clouds are mainly middle and high level clouds leftover from rained out thunderstorms. The clouds are located this morning over  Iowa, Kansas, and Oklahoma. The cloud band from the Dakotas to western Minnesota is part of a system moving with the stronger SW to NE flow aloft crossing the Dakotas. It contains weakening showers that should dissipate before regenerating this afternoon and evening as it moves over Northern Minnesota, Lake Superior, and into Canada. Thunderstorms are also occurring over Louisiana and northeastern Florida.

Low pressure aloft along the Washington-Oregon coast is creating showers in parts of Washington and Oregon with very spotty activity in the Idaho panhandle and northwestern Montana. As the system moves northeast thunderstorms are likely this afternoon over parts of northern Montana as cooler air aloft rides over warmer and relatively moist low level air.

Springtime Weather Extremes

With spring comes weather extremes. The are several reasons why but one of the most important is advancing warmer air moving north in response to the Sun moving higher in the Northern Hemisphere sky. Storms tend to travel parallel to the boundary dividing cold from warm air.

The map above shows the boundary with a storm centered over southeastern Minnesota. The red and blue dashed lines extending from Canada to the Dakotas, Minnesota, to Wisconsin and Michigan show the greatest temperature change. Generally the change from red to blue lines is the dividing line between rain and snow. Iowa will experience a milder day today as west and southwest winds sweep across the state bringing warmer air from the Plains across the state. Readings will be in the 60s and 70s - a far cry from the colder weather of the past couple of days.

The map is the forecast for 1:00 p.m. CDT this afternoon (Sunday, April 3rd). The bulls-eye over southeast Minnesota is the predicted center of low pressure at 1:00 p.m. In the meantime much colder air and snow occupies the area from northern Minnesota across the Great Lakes to New England.  Springtime does bring extremes across both distance and time.

Altocumulus lenticularis

This photo shows a layer of altostratus on top with wavy altocumulus lenticularis below. Altostratus means "high stratus' and altocumulus is "high cumulus." Lenticularis indicates the clouds are lens shaped. The lenticularis pattern is created atmospheric waves create undulations in the flow. If the wavy motion is in a moist layer condensation occurs in rising air near the wave crests while evaporation occurs where the air is sinking.  Aircraft flying atmospheric waves will often get a rough ride.

Unusual Altocumulus

This unusual layer of altocumulus clouds was visible from Cedar Falls this morning shortly after 7:30 CST. The top photo shows a wide view (17 mm) while the bottom photo was shot at 104 mm. I have watch the sky for over 60 years and have never seen a formation quite like this. There appears to be a combination of gravity waves acting with weak convective instability in an area of warm advection aloft to create the pattern. The cloud area was moving toward the south (L to R). The surface air temperature was 6 degrees F.